|
|
Post by acidohm on Aug 8, 2015 6:05:48 GMT
|
|
|
|
Post by missouriboy on Aug 8, 2015 16:04:16 GMT
|
|
|
|
Post by acidohm on Aug 8, 2015 17:54:52 GMT
Iceland and north Scandinavia have essentially had no summer by all accounts...
Oh, and I am praying the warmists look stupid in Paris!!
|
|
|
|
Post by sigurdur on Aug 9, 2015 15:42:48 GMT
|
|
|
|
Post by missouriboy on Aug 9, 2015 18:56:00 GMT
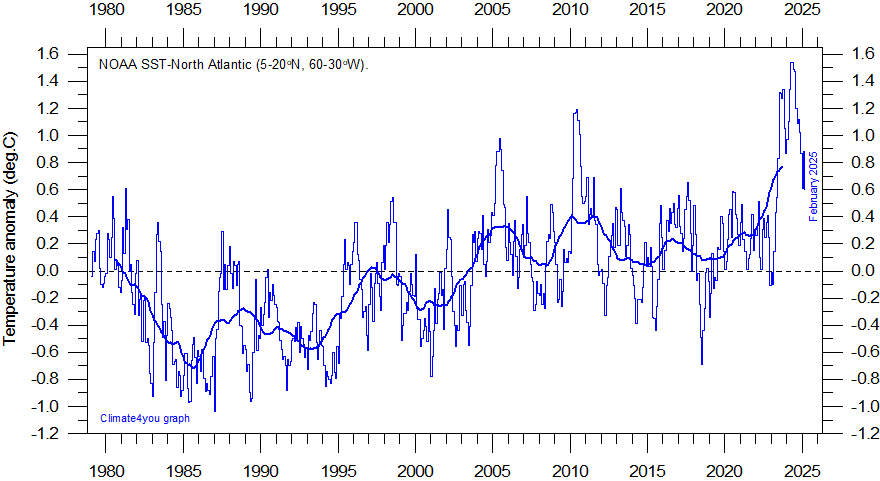 Wow......... I followed up on the source of this graph. www.climate4you.com/ It IS NOT, as we might assume, the NORTHERN North Atlantic. If you click on 'oceans' in the left-margin topic bar of this link and scroll down, you will find that this is for the SST anomalies in the North Atlantic between 5 and 20 degrees north latitude, i.e., the rapidly cooling parts of the southern portions of the North Atlantic gyre (the southern-most parts of the blue blob). Interestingly, there is no corresponding graph for the northern parts of the gyre. HOWEVER, further down, there is a chart showing heat-content anomalies (0-700 m depth) for the North Atlantic 30-65 degrees north. Note that the heat content anomaly has declined by ~50 percent in the same time frame (since 2005). This represents about 1/3 of the total anomaly change since 1979 (low to high in 2005). 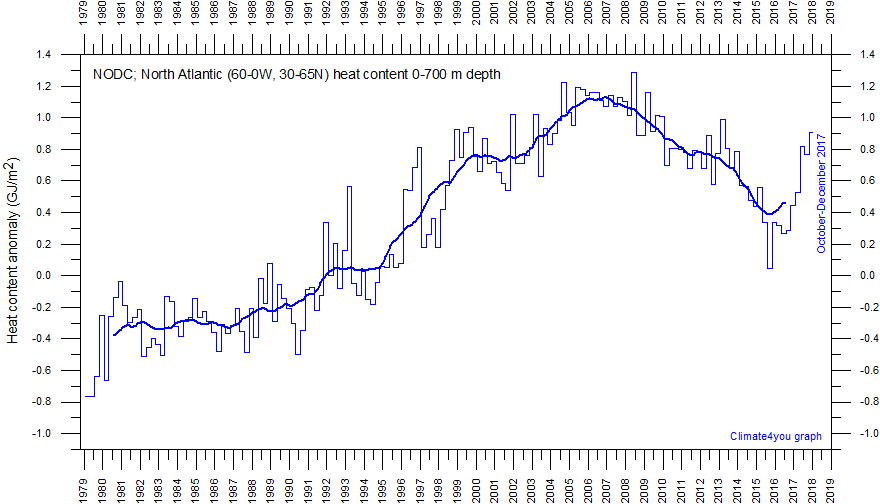 Further down, you'll note a chart for the North Atlantic Current temperature transect at 59 degrees north. Note a temperature decline of about 10 percent over the same time frame. 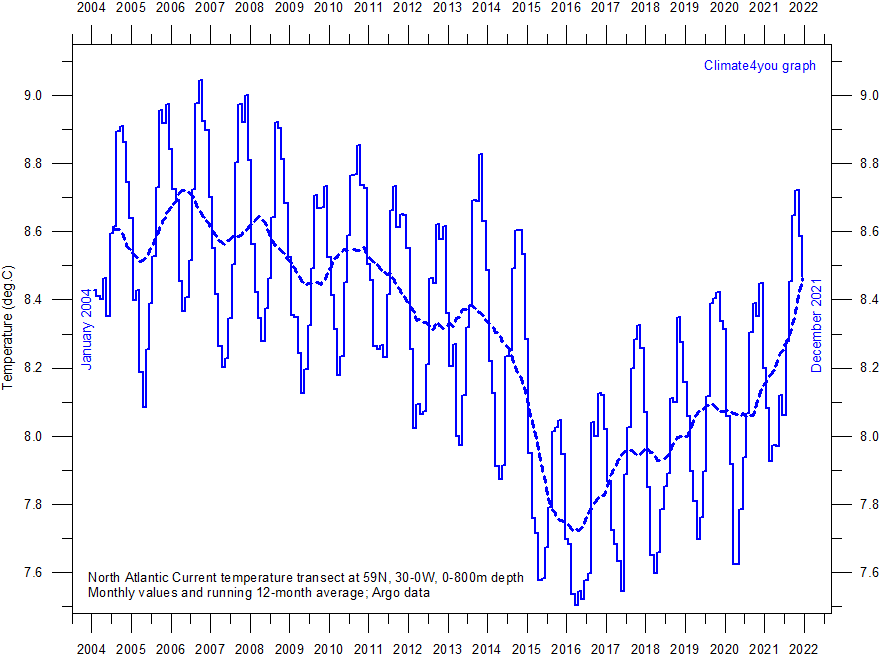 A final question for those in the know (i don't). One recent post suggested that a dipole pattern (north to south) of warm, cold, and warm was responsible for the cold Western European winters of 2009-10 and 2010-11, as it resulted in a high
pressure area west of Great Britain that brought cold waves from the north. Currently (if it doesn't change) we have a
dipole pattern (north to south) of cold, warm, and cold. What does that do for Europe?
Either way, hedge with them jammie liners! 
|
|
|
|
Post by nonentropic on Aug 9, 2015 19:09:12 GMT
Great graphs and very interesting.
Just one comment I hate 10% temperature as a description most especially when the start temperature is largely nominal.
The world runs three zero points, absolute, centigrade and Fahrenheit.
I must say there is a lot to worry about as these temps are dropping for some time now and well into their work.
|
|
|
|
Post by acidohm on Aug 9, 2015 19:54:35 GMT
One recent post suggested that a dipole pattern (north to south) of warm, cold, and warm was responsible for the cold Western European winters of 2009-10 and 2010-11, as it resulted in a high
pressure area west of Great Britain that brought cold waves from the north. Currently (if it doesn't change) we have a
dipole pattern (north to south) of cold, warm, and cold. What does that do for Europe?
Either way, hedge with them jammie liners!
[/quote] That may have been me....but I have seen use of a 'tri'pole scenario to be picky (sorry) I will update the animation I started and then if/when this tripole persists. .I may pose this question regarding possible negative NAO to an expert....if I can find one ;-)....my understanding is if the tripole exists, cold conditions N Europe predominate but with anything weather orientated there is a probability attached. Thx for looking into the data Missouriboy...your much better at picking that stuff apart then I!!! Also....I kinda looked at tripole being warm belt either side of Greenland. ..cold north atlantic warm temperate belt.... Where I'd need expert opinion is my interpretation of a warm belt either side of Greenland as consistent with what has been identified historically.. |
|
|
|
Post by sigurdur on Aug 9, 2015 20:51:53 GMT
Careful on the historic part. Temps North of 60n are pretty sparse till about 20 years ago. Even now there is a lot of infilling.
|
|
|
|
Post by missouriboy on Aug 12, 2015 15:41:04 GMT
|
|
|
|
Post by acidohm on Aug 12, 2015 17:48:23 GMT
Nice!!! thx for posting!! :-) |
|
|
|
Post by Ratty on Aug 12, 2015 23:12:57 GMT
|
|
|
|
Post by missouriboy on Aug 13, 2015 13:06:06 GMT
Are you kidding? There's heat gone missing in the ocean and we've GOT to find it!!!! It's a travesty ... a travesty i say (Trenberth)! |
|
|
|
Post by missouriboy on Aug 15, 2015 17:10:31 GMT
Here I repost an article posted by ratty on the Antarctic thread. Written in the same year as 'The Day After Tomorrow' was released. www.commondreams.org/views04/0130-11.htmI note that the author states the following regarding past slowdowns in the 'salt-conveyor belt' (aka the AMOC). ".the abrupt cooling in the last warm period shows that a flip can occur in situations much like the present one. What could possibly halt the salt-conveyor belt that brings tropical heat so much farther north and limits the formation of ice sheets? Oceanographers are busy studying present-day failures of annual flushing, which give some perspective on the catastrophic failures of the past. "In the Labrador Sea, flushing failed during the 1970s, was strong again by 1990, and is now declining. In the Greenland Sea over the 1980s salt sinking declined by 80 percent. Obviously, local failures can occur without catastrophe - it's a question of how often and how widespread the failures are - but the present state of decline is not very reassuring." The 1970s, of course, were at the bottom of the last negative phase of the AMO ... about a decade after the negative shift started. Same as today??? Less arctic melting?  Seems like a long lag period if global warming melts the ice (1940s to 60s?) which then smothers the subduction zones??? If this is the mechanism, then there should be some relationship in the record ... assuming there is a record. Does anyone know of a data base that tracks an index for this phenomena that can be compared
to AMOC flow and temperature time series from the instrument arrays??? Or is the author just pulling percentages from his nether regions? Or ... does flearider's theory deserve more attention? This would be the time for serious measurement and documentation. |
|
|
|
Post by flearider on Aug 16, 2015 15:36:54 GMT
with them changing the size of the Antarctic ice .. I'm sure there on to my theory surly something so small could not effect the whole planet ..
but where did all that ice go ?? that's to say if there not hiding it ..if it's not there may I suggest we look at the east coast of Australia..but that would not be right as the currents are the wrong way it should be coming up beside chilli first .. but at the same time we have a very large polar jet stream it's a confusing time ..
|
|
|
|
Post by acidohm on Aug 16, 2015 15:47:42 GMT
Acidohm ... if that were a stock chart you'd probably be getting a little worried right about now! Do you have a direct link to that data you'd care to share? Actually...I just realised this graph does kinda match ftse over last 3/4 years!! |
|


