|
|
Post by icefisher on May 25, 2014 18:19:51 GMT
The Schtick reports: New paper finds natural variability of N Carolina climate explained by solar activity & AMO The AMO defined by NOAA as: "The AMO is an ongoing series of long-duration changes in the sea surface temperature of the North Atlantic Ocean, with cool and warm phases that may last for 20-40 years at a time and a difference of about 1°F between extremes. These changes are natural and have been occurring for at least the last 1,000 years."North Carolina is adjacent to the Atlantic and can be expected to be affected by the temperatures along its eastern seaboard. The Sun (despite climatologist claims otherwise) will also be expected to have an effect based on cycle length and strength. Seems to be a long way around with lots of complex transforms to arrive at what a fisherman on the Outer Banks could have told them  Yep, Willis over at WUWT is doing fruitless analytical work in search of an 11 year pattern in solar changes reflected in the climate record. The fact is the oceans directly absorb a vast majority of radiation from the sun and it takes about as long as the entire solar cycle is long for just the upper ocean to adjust to changes in radiation. Effectively cycling upper ocean temperatures is a 20+ year project. I have heard estimates that the ocean and other waters end up with about 90% of the heat from the sun. That would play into other physical processes of the heat coming out of the oceans to warm the atmosphere. Its not hard to see why it would be very difficult to see any change from such a short cyclical pattern of the sun. Feedbacks and the slow response of the oceans eliminates its signature. Science pooh poohed the sun based upon not seeing the effects of the short solar cycle even though our climate record tracks longer term solar changes. Ocean damping moves the 11 year solar cycle down into a range of temperatures where sampling error completely obscures it. The acknowledged error in the global instrument record is so high that no credence is given to absolute temperature. Credence is given to anomalies on the basis of long term trends. Its why climate science was able to ignore no warming for so long and continue to loudly advocate the CO2 mechanism, whose credence is completely built on the lack of alternative explanations (per IPPC AR3). Now its a matter of a long term departure from warming with no explanation, which calls into question everything that is modern climate science. Clearly both the astrometeorologists and the fishermen are way ahead of science on all this. The CO2 theory of climate change is now the Spruce Goose of aviation science. It flies but its of no value except as a curiosity. I am sure Long Beach is still looking for a long term exhibit to put in the old Spruce Goose Dome, it could be turned into a monument for CO2 climate science and have great long term educational value. |
|
|
|
Post by sigurdur on May 25, 2014 20:35:25 GMT
The whole thing about AGW to watch for is when the trend line up stops. Has it actually stopped now?
|
|
|
|
Post by cuttydyer on Jun 5, 2014 17:29:22 GMT
Anthony Watts reports: Chinese study ‘implies that the “modern maximum” of solar activity agrees well with the recent global warming’  A recent study demonstrates the existence of significant resonance cycles and high correlations between solar activity and the Earth’s averaged surface temperature during centuries. This provides a new clue to reveal the phenomenon of global warming in recent years.  This shows comparisons between the 11-year running averaged Total Solar Irradiance (TSI) and the temperature (T) anomalies of the Earth (global, land, ocean). Their work, entitled “Periodicities of solar activity and the surface temperature variation of the Earth and their correlations” was published in CHINESE SCIENCE BULLETIN (In Chinese) 2014 No.14. The co-corresponding authors are Dr. Zhao Xinhua and Dr. Feng Xueshang from State key laboratory of space weather, CSSAR/NSSC, Chinese Academy of Sciences. It adopts the wavelet analysis technique and cross correlation method to investigate the periodicities of solar activity and the Earth’s temperature as well as their correlations during the past centuries. Global warming is one of the hottest and most debatable issues at present. The Intergovernmental Panel on Climate Change (IPCC) claimed that the release of the anthropogenic greenhouse gases contributed to 90% or even higher of the observed increase in the global average temperature in the past 50 years. However, the debate on the causes of the global warming never stops. Research shows that the current warming does not exceed the natural fluctuations of climate. The climate models of IPCC seem to underestimate the impact of natural factors on the climate change, while overstate that of human activities. Solar activity is an important ingredient of natural driving forces of climate. Therefore, it is valuable to investigate the influence of solar variability on the Earth’s climate change on long time scales.  Figure 1: The global wavelet coherence between Sunspot number (a), Total Solar Irradiance (b) and the anomalies of the Earth’s averaged surface temperature. The resonant periodicities of 21.3-year (21.5-year), 52.3-year (61.6-year), and 81.6-year are close to the 22-year, 50-year, and 100-year cycles of solar activity. This innovative study combines the measured data with those reconstructed to disclose the periodicities of solar activity during centuries and their correlations with the Earth’s temperature. The obtained results demonstrate that solar activity and the Earth’s temperature have significant resonance cycles, and the Earth’s temperature has periodic variations similar to those of solar activity (Figure 1). This study also implies that the “modern maximum” of solar activity agrees well with the recent global warming of the Earth. A significant correlation between them can be found (Figure 2).  Figure2: This shows comparisons between the 11-year running averaged Total Solar Irradiance (TSI) and the temperature (T) anomalies of the Earth (global, land, ocean). As pointed out by a peer reviewer, “this work provides a possible explanation for the global warming”. See the article: ZHAO X H, FENG X S. Periodicities of solar activity and the surface temperature variation of the Earth and their correlations (in Chinese). Chin Sci Bull (Chin Ver), 2014, 59: 1284, doi: 10.1360/972013-1089 csb.scichina.com:8080/kxtb/CN/abstract/abstract514043.shtmlScience China Press Co., Ltd. (SCP) is a scientific journal publishing company of the Chinese Academy of Sciences (CAS). For 60 years, SCP takes its mission to present to the world the best achievements by Chinese scientists on various fields of natural sciences researches. |
|
|
|
Post by cuttydyer on Jun 14, 2014 6:51:42 GMT
Paper predicts temperature decrease by 2020 of up to 1C due to low solar activity.  From the HockeySchtick: A paper published in the Journal of Atmospheric and Solar-Terrestrial Physics finds long solar cycles predict lower temperatures during the following solar cycle. A lag of 11 years [the average solar cycle length] is found to provide maximum correlation between solar cycle length and temperature. On the basis of the long sunspot cycle of the last solar cycle 23, the authors predict an average temperature decrease of 1C over the current solar cycle 24 from 2009-2020 for certain locations.  Highlights ? A longer solar cycle predicts lower temperatures during the next cycle. ? A 1 °C or more temperature drop is predicted 2009–2020 for certain locations. ? Solar activity may have contributed 40% or more to the last century temperature increase. ? A lag of 11 years gives maximum correlation between solar cycle length and temperature. The authors also find “solar activity may have contributed 40% or more to the last century temperature increase” and “For 3 North Atlantic stations we get 63–72% solar contribution [to the temperature increase of the past 150 years]. This points to the Atlantic currents as reinforcing a solar signal.” A co-author of the paper is geoscientist Dr. Ole Humlum, who demonstrated in a prior paper that CO2 levels lag temperature on a short-term basis and that CO2 is not the driver of global temperature. The paper: The long sunspot cycle 23 predicts a significant temperature decrease in cycle 24 Jan-Erik Solheim Kjell Stordahl Ole Humlumc DOI: 10.1016/j.jastp.2012.02.008 Link: www.sciencedirect.com/science/article/pii/S1364682612000417Schtick link: hockeyschtick.blogspot.co.uk/2014/06/new-paper-predicts-temperature-decrease.html |
|
|
|
Post by duwayne on Jun 15, 2014 13:43:06 GMT
The Joannenova blog is carrying a piece by Dr. David Evans which purportedly will show that the CO2 effects on global warming are far overstated by the warmists and the sun is the major driver of temperatures. Here is a snippet from his first of a series of posts. Guest post by Dr David Evans, 14 June 2014
We’ve been working on this for a year and a half, gradually building up the pieces bit by bit, gradually filling in a picture that is now almost complete. We’ve been bursting to tell the world about it for months, but always noting it would be better if developed and tested before it went public. (How long is a piece of string?) The big danger is that an inadequately explained or prepared alternative explanation of how the climate works will not be given proper consideration, and thereafter will be ignored as “debunked”. There is never a perfect time, but we’ve reached the point where the theory will be tested and developed better by open review. It’s time to set it free…We will be serializing the project as a series of posts, one every day or two. The broad outline of the project, without revealing the major ingredients just yet, is as follows.
We explore some climate datasets and find something interesting, which provides a clue to building up a solar model. We think we have deduced the nature of the indirect solar force that largely influences temperature here on Earth. We get a physical model with physical interpretations (that is, not just curve fitting), working models, and decent fit to observed data.
Both the CO2 model and the new solar model are viable explanations of the global warming of the last century. Any linear mix (e.g. 60% CO2, 40% solar) also fits the observed temperatures. On the performance of the models over the last century, we cannot tell which is correct. However, over the next decade the models predict dramatically different things: the CO2 model of course predicts warming, while the solar model predicts a sharp fall in temperature very soon.
We don’t have to wait to determine whether it is the CO2 or solar model that is more correct. The answer lies in the changes in the height of the water vapor emissions layer, because the influences of CO2 and the indirect solar force are different. From this we are able to determine the cause of global warming and the maximum extent to which the recent global warming was due to CO2. We also clear up a few theoretical befuddlements about the influence of CO2 that may have caused warmists to overestimate the potency of rising CO2.
The fans of the CO2 dominant models are not going to be happy. It seems the climate is an 80-20 sort of thing, where there is a dominant influence responsible for 80% of climate change and a tail of 20% of other factors. It turns out that the CO2 concentration is not the 80% factor, but in the 20% tail. An indirect solar influence seems to be the main factor.On joannenova.com.au scroll down to "BIG NEWS: Part I" to read the first installment.
|
|
|
|
Post by sigurdur on Jun 15, 2014 14:03:40 GMT
duwayne:
Thank you for the link to this!!!
Will be interesting reading.
|
|
|
|
Post by AstroMet on Jun 16, 2014 0:08:46 GMT
The Joannenova blog is carrying a piece by Dr. David Evans which purportedly will show that the CO2 effects on global warming are far overstated by the warmists and the sun is the major driver of temperatures. Here is a snippet from his first of a series of posts. Guest post by Dr David Evans, 14 June 2014
We’ve been working on this for a year and a half, gradually building up the pieces bit by bit, gradually filling in a picture that is now almost complete. We’ve been bursting to tell the world about it for months, but always noting it would be better if developed and tested before it went public. (How long is a piece of string?) The big danger is that an inadequately explained or prepared alternative explanation of how the climate works will not be given proper consideration, and thereafter will be ignored as “debunked”. There is never a perfect time, but we’ve reached the point where the theory will be tested and developed better by open review. It’s time to set it free…We will be serializing the project as a series of posts, one every day or two. The broad outline of the project, without revealing the major ingredients just yet, is as follows.
We explore some climate datasets and find something interesting, which provides a clue to building up a solar model. We think we have deduced the nature of the indirect solar force that largely influences temperature here on Earth. We get a physical model with physical interpretations (that is, not just curve fitting), working models, and decent fit to observed data.
Both the CO2 model and the new solar model are viable explanations of the global warming of the last century. Any linear mix (e.g. 60% CO2, 40% solar) also fits the observed temperatures. On the performance of the models over the last century, we cannot tell which is correct. However, over the next decade the models predict dramatically different things: the CO2 model of course predicts warming, while the solar model predicts a sharp fall in temperature very soon.
We don’t have to wait to determine whether it is the CO2 or solar model that is more correct. The answer lies in the changes in the height of the water vapor emissions layer, because the influences of CO2 and the indirect solar force are different. From this we are able to determine the cause of global warming and the maximum extent to which the recent global warming was due to CO2. We also clear up a few theoretical befuddlements about the influence of CO2 that may have caused warmists to overestimate the potency of rising CO2.
The fans of the CO2 dominant models are not going to be happy. It seems the climate is an 80-20 sort of thing, where there is a dominant influence responsible for 80% of climate change and a tail of 20% of other factors. It turns out that the CO2 concentration is not the 80% factor, but in the 20% tail. An indirect solar influence seems to be the main factor.On joannenova.com.au scroll down to "BIG NEWS: Part I" to read the first installment. The real problem is that while the useless 'debate' over CO2 and human-induced global warming tries to equal itself to what is obvious, and scientifically proven: that the Sun is the cause of all climate change, the years are now shorter to climate change to global cooling - which is coming to a region near everyone. The years of playing with expensive climate computer models by those who cannot forecast short-range weather (10 days out) or monthly and seasonal, is going to end badly in just a few short years when global cooling becomes the new regime. Facts are that for over two decades, climate science has been perverted by careerists who have made 'warm-is-bad' simply to expand their careers while towing a politically-correct propaganda on pink elephants can fly (man-made global warming.) Meanwhile, as solar cycle #25 approaches with the Sun's hibernation phase after the mini-max of solar cycle #24 this year, and in 2015, 2016, by December 2017 global cooling will be the official new climate regime and that will be that. There is no stopping it, and all anyone can do is to forecast (which I am doing on this) and also to prepare (which I strongly encourage everyone else to do.) Global cooling is no joke and it will impact every facet of life on Earth for the next three decades. |
|
|
|
Post by sigurdur on Jun 16, 2014 1:56:33 GMT
Theodore:
Global cooling actually started in the early 2000's. The land based temp trajectory was broken after the El Nino of 1998-99. The trend of 25 years or so of increasing temperatures came to a halt. Climate folks call the current cooling the "Pause", and have about a zillion reasons for it.
Part of the reason for the "Pause" is the PDO cycle, which climate folks still like to ignore. Just like they like to ignore the ADO.
It is hard to fix stupid.
There are solar dynamics, but there are also long term ocean circulation dynamics. Some currents have 1,000 year cycles.
|
|
|
|
Post by trbixler on Jun 16, 2014 2:07:59 GMT
Sig
So much of stupid is being paid to be stupid. Obama exemplifies the pay for stupid and get control. AGW has been dead for many years but pay for stupid goes on, it is totally political. As an aside the sun does not do political!
|
|
|
|
Post by douglavers on Jun 16, 2014 5:28:31 GMT
Looking at the article quoted by Cuttydyer above, I distinctly recall David Archibald writing a paper on exactly this effect about (?) five years ago.
|
|
|
|
Post by AstroMet on Jun 16, 2014 16:22:47 GMT
Theodore: Global cooling actually started in the early 2000's. The land based temp trajectory was broken after the El Nino of 1998-99. The trend of 25 years or so of increasing temperatures came to a halt. Climate folks call the current cooling the "Pause", and have about a zillion reasons for it. Part of the reason for the "Pause" is the PDO cycle, which climate folks still like to ignore. Just like they like to ignore the ADO. It is hard to fix stupid. There are solar dynamics, but there are also long term ocean circulation dynamics. Some currents have 1,000 year cycles. Sigurdur, the 'trending' to global cooling did begin in 2001, but the climate state of global cooling until December 2017. And since 2001, the Earth still had been in the solar-forced cycle of global warming and the trend to the transition to global cooling - in-between climate states - began that year. It has been the reason for the extremes of weather during the last decade. As for many of the pieces, like the PDO, AO and so-called 'warm pause'(yes, it is very hard to fix stupid) these are pieces, but as usual, many are not able to synthesize to actually forecast what is coming here in the real world. That has been made very clear by the corrupt altering of weather data over the years (before they finally admitted that the cooling trend was obvious in 2010) because of the propaganda of man-made global warming that continues in this solar year of 2014. Those climate folks who go about about how 'warm-is-bad' will find, by the years 2020-2022, just how totally wrong and way off the mark they were with the pink elephants can fly business (man-made global warming.) |
|
|
|
Post by cuttydyer on Jun 17, 2014 8:13:00 GMT
Dr David Whitehouse asks: IS IT THE SUN STUPID?Date: 11/06/14 Dr David Whitehouse The publication of research into the solar-climate connection by Chinese astronomers, albeit in an obscure publication, has once again posed the question whether the recent warming observed on Earth has something to do with the sun’s behaviour. The usual answer is that solar changes are too small to account for terrestrial changes both in absolute and relative terms. Changes in solar irradiance are small in relative terms, amounting to about 0.1% of the sun’s output – called the solar ‘constant.’ But that 0.1% in absolute terms is a huge number given the size of the solar constant – the amount of energy coming from the sun. In real terms it has an effect over the 11-year solar cycle about equal to the forcing caused by changes in greenhouse gasses over the same period. This is often a surprise for those who automatically discount solar influences. There is however a qualitative difference between solar and greenhouse gas forcing. Solar is cyclic – up and down – whereas greenhouse gas forcing is monotonically increasing. So solar variations are short-term fluctuations on a long-term upward trend of higher temperatures on Earth. Unless that is there is a long-term trend in the solar constant. Estimating the value of the solar constant before the onset of space-borne instrumentation is difficult and subject to large uncertainties. We do know that the solar constant does vary and has increased to some degree since the Little Ice Age. One way to estimate the output of the sun is to link it to sunspot numbers that go back to 1609. Sunspot numbers clearly show the 11-year solar cycle as well as the Maunder Minimum between about 1640 -1720 (coincident with the Little Ice Age) as well as the so-called Grand Solar Maximum of the 20th century when sunspot activity has been estimated to be the strongest in many thousands of years. Analysing sunspot numbers as an indicator of solar activity shows a peak in the 1950s and the 1980s. One could simply correlate the increasing sunspot activity with rising global temperatures and say ah ha, there is a connection. But whether or not this is acceptable to many scientists – in the UK and the USA mainly – depends upon how it is done. If, as these Chinese scientists have done, a correlation is found (between Total Solar Irradiance and global surface temperature) then it is treated as dubious. But if one reaches the opposite conclusion the reception can be somewhat different. 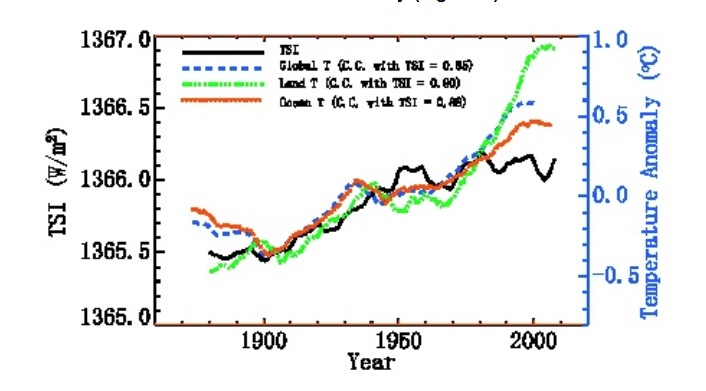 A case in point is a now infamous paper written a few years back. It was written just after there were hints that the sun’s activity was tailing off from the grand high of the 20th century. It looked at the rising temperature of the Earth and the rising and then falling solar activity and said because the sun’s activity was declining and the earth’s temperature was still rising there was no correlation. It was a paper that was definitely of its time being written just as the recent global surface temperature pause was being recognised. Today if a similar analysis was performed using up-to-date data it would have to reach the opposite conclusion. But when it comes to the possibility of a link between changes in solar activity and climate change, correlations between changing solar parameters and global temperature can arouse suspicions but they only go so far. It is true that when faced with a series of observations one of the first questions a scientist will ask is, what does it correlate with? These Chinese scientists have shown us once again that there is a correlation between solar activity and global surface temperature over long periods. At present it is an inconvenient fact to some, and a fact that we cannot really explain. Feedback: david.whitehouse@thegwpf.org Link: www.thegwpf.org/is-it-the-sun-stupid/ |
|
|
|
Post by cuttydyer on Jun 24, 2014 14:14:26 GMT
The schtick reports: New paper finds solar activity explains abrupt slowdown of Atlantic Meridional Overturning Circulation [AMOC]A paper under review for Climate of the Past finds low solar activity explains an abrupt slowdown of the Atlantic Meridional Overturning Circulation [AMOC] during the period 1915-1935.  According to the authors, the modeled mechanism is "The weakened AMOC can be explained in the following. The weak total solar irradiance (TIS) during early twentieth century decreases pole-to-equator temperature gradient in the upper stratosphere. The North polar vortex is weakened, which forces a negative North Atlantic Oscillation (NAO) phase during 1905–1914. The negative phase of NAO induces anomalous easterly winds in 50–70° N belts, which decrease the release of heat fluxes from ocean to atmosphere and induce surface warming over these regions. Through the surface ice–albedo feedback, the warming may lead to continuously melting sea ice in Baffin Bay and Davis Strait, which results in freshwater accumulation. This can lead to salinity and density reductions and then an abrupt slowdown of AMOC." Paper link: www.clim-past-discuss.net/10/2519/2014/cpd-10-2519-2014.htmlSchtick link: hockeyschtick.blogspot.co.uk/2014/06/new-paper-finds-solar-activity-explains.html |
|
|
|
Post by icefisher on Jun 24, 2014 22:21:34 GMT
The schtick reports: New paper finds solar activity explains abrupt slowdown of Atlantic Meridional Overturning Circulation [AMOC]A paper under review for Climate of the Past finds low solar activity explains an abrupt slowdown of the Atlantic Meridional Overturning Circulation [AMOC] during the period 1915-1935. That associates the robust global warming period from 1912 to 1944 with a slowdown of the AMOC. It should be noted the slow solar activity covered the period 1878-1913, essentially creating a warming that was at least in part feedback. This is fitting comfortably with my theory on the ocean oscillation feedback loop. I have not attributed an initiating cause to the ocean oscillations however. Fact: We have poorer information on the ocean oscillations as we go back further. So that may explain why the low solar activity of 1905-1914 resulted in in ocean surface warming in subsequent decades, but the low solar activity from 1878 to 1905 is not indicated as having resulted in ocean surface warming because there is little doubt that didn't happen. The low solar activity beginning in 1878 resulted in cooling, only later did warming occur after solar activity began its increase in 1913. Beyond that all these climate impacts and thermohaline current effects are in complete agreement with my theory. What is not mentioned is the low solar activity results in surface cooling (as we are currently seeing and saw in 1878 to 1911) this then according to my theory results in more ice and more reductions in heat fluxes from the ocean into the atmosphere. I think Nautonnier was the first around here to say that heat in the atmosphere is heat on its way to space. All this is very consistent with this notion as well. A more cynical view of the author motivations might be that it doesn't feed the panic mill to suggest that it might take another 20 years for warming to resume with cooling in the interim. Solar activity wise we are most equivalent to 1884 today. |
|
|
|
Post by sigurdur on Jun 24, 2014 22:26:08 GMT
Icefisher:
I call it the open barn door, the heat in the atmosphere.
|
|


