|
|
Post by kenfeldman on May 8, 2014 18:54:19 GMT
Here's an image that shows the relative importance of climate forcings. CO2 is still number one. You've inferred that CO2 is the primary player in climate forcings, so looking at the Antarctic trend below exactly which periods would you say were as a result of CO2 forcing and which periods were as a result of solar forcing? Cutty, that's a really good question. I'm not aware of any proxy records for solar forcing going back more than 10,000 years or so. Do you have a link to a good paper on something going back more than that length of time? For the sun, we assume that there is a normal range of activity, from long minimums like the Maundar minimum to periods of greater activity, like we saw in the 1960s. We can look at the minimums in the approximately 11-year cycle and compare it to the maximums and see that there is an approximately 0.1 degree C effect on global temperatures in the short term. Given the proxy data over the past 10,000 years, we can assume that the relative effect is similair. Combined with volcanic eruptions, which can screen out incoming solar radiation and cool the Earth, this can lead to little ice ages and then periods of recovery. However, I haven't seen a paper that addresses the solar forcing over the period of deglacation in the image you posted, so we can't be certain on the relative importance of variations in the solar forcing over that whole time period. To address your question on CO2 forcing over that time period, here is link to a paper that explains the effects of increases in carbon dioxide concentrations during the last deglaciation.Here is the abstract from the paper, published in 2012: |
|
|
|
Post by kenfeldman on May 8, 2014 19:11:57 GMT
What happened to old-fashioned water vapour? Also, I think that CO2 concentrations have varied wildly in the past, well before SUVs were invented. Water vapor appears to be the most important feedback in global warming. You can calculate that a doubling of CO2 will lead to an increase of 1.2 degrees C in temperature. That increase in temperature would allow more water to be evaporated and increase the water vapor feedback, which can double the initial warming from CO2 alone. Here's a link to an explanation of how water vapor feedback works.As to CO2 concentrations varying in the past, that's true. However, a lot of the CO2 that used to be in the atmosphere millions of years ago when the planet was ice-free was safely buried as carbon in what became oil fields and coal beds. Bringing that carbon back up to the surface, burning the coal and oil, and releasing it into the atmosphere as CO2 will lead to higher temperatures as the planet had when that CO2 was in the atmosphere millions of years ago. |
|
|
|
Post by douglavers on May 9, 2014 6:02:38 GMT
Kenfeldman
I am not sure about that explanation.
I thought that the problem with increasing water vapour was that it also increased cloudiness. [Known to be mishandled by models].
Apparently, this can lead to NEGATIVE temperature sensitivity to increasing H2O concentration.
With carbon dioxide, I have never accepted that doubling the concentration will have a huge impact on temperature. The CO2 absorption bands are already pretty well saturated.
It is strange that in the coldest period on Earth for the last 500 million years, CO2 concentrations were apparently at ten times' today's levels [Ordovician Glaciation].
|
|
|
|
Post by cuttydyer on May 9, 2014 7:12:07 GMT
Cutty, that's a really good question. I'm not aware of any proxy records for solar forcing going back more than 10,000 years or so. Do you have a link to a good paper on something going back more than that length of time? The studies I've seen only go back 10K; here's two: (when I get time I'll have a dig and see what I can find ).  Figure below: Comparison of solar activity (blue curve) and the Asian climate development (green curve, delta 18O of a stalagmite in a Chinese cave) for the last 9000 years (both curves normalized). One clearly sees a good agreement between the two curves, which strongly suggests a significant climate impact by the sun. 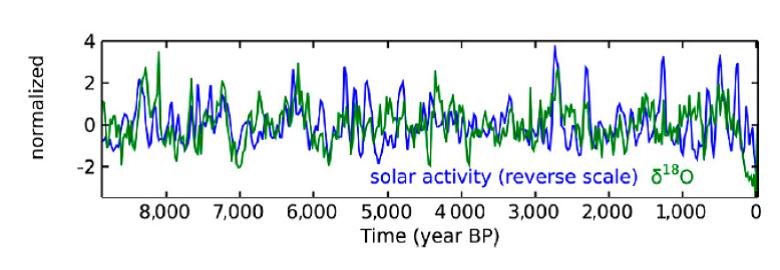 Paper link: www.pnas.org/content/109/16/5967.abstract Paper link: www.sciencemag.org/content/294/5549/2130.abstract |
|
|
|
Post by nautonnier on May 9, 2014 16:49:52 GMT
Here's an image that shows the relative importance of climate forcings. CO2 is still number one. Maybe not Maris, but Aaron  I also note that there is no Water Vapor in that bar chart, considering water vapor and clouds account for 66 to 85 percent of the greenhouse effect, compared to a range of 9 to 26 percent for CO2. This is because of a sleight of hand by climate 'scientists' who just claim that water vapor is a 'feedback' as if there would be no water vapor if there was no CO2 in the atmosphere - an obvious falsehood. |
|
|
|
Post by cuttydyer on May 10, 2014 6:39:25 GMT
Looking like the Sun's "get up & go" has gone. Latest AP graph:  All down hill from here?  Current cycle is a good match for solar cycle 12:  Cycle 12 began in December 1878 and ended in March 1890; some very interesting weather events occurred during & around that cycle. Historical weather link: booty.org.uk/booty.weather/climate/1850_1899.htm |
|
|
|
Post by sigurdur on May 10, 2014 12:56:06 GMT
I have no idea of the mechanism, but there is ample historic evidence that the weather gets screwy when the sun is screwy.
|
|
|
|
Post by cuttydyer on May 10, 2014 16:56:18 GMT
I have no idea of the mechanism, but there is ample historic evidence that the weather gets screwy when the sun is screwy. Sig, My money is on top down solar modulation of the jet streams. During solar cycles with low output the jets become loopy. When the peak of these weak cycles is reached the loopy jets pickup speed (as witnessed by the UK recently). |
|
|
|
Post by sigurdur on May 10, 2014 17:09:59 GMT
I have no idea of the mechanism, but there is ample historic evidence that the weather gets screwy when the sun is screwy. Sig, My money is on top down solar modulation of the jet streams. During solar cycles with low output the jets become loopy. When the peak of these weak cycles is reached the loopy jets pickup speed (as witnessed by the UK recently). I agree that the jets react to the sun with lower consistent sunspots. I just don't know why this happens, but the historical record confirms that it happens. |
|
|
|
Post by nautonnier on May 10, 2014 21:28:04 GMT
Sig, My money is on top down solar modulation of the jet streams. During solar cycles with low output the jets become loopy. When the peak of these weak cycles is reached the loopy jets pickup speed (as witnessed by the UK recently). I agree that the jets react to the sun with lower consistent sunspots. I just don't know why this happens, but the historical record confirms that it happens. If you read Stephen Wilde you will see that he feels it is the drop in the UV from the Sun that leads to the latitudinal jetstreams. This in turn increases the Ferrel Cell to Hadley Cell boundary length meaning the cloudiness in the temperate latitudes increases reducing the heat penetrating into the oceans. At the same time the reduction in UV and high frequency energy entering the oceans also means that ocean heat content reduces - a double whammy. The current jetstreams are not exactly meridonal and are even more disturbed around the Antarctic where normally they are really tight |
|
|
|
Post by cuttydyer on May 12, 2014 5:06:35 GMT
A new paper published in Climate of the Past finds the low solar activity during the Dalton Minimum from 1780-1840 had a significant effect on climate and ocean heat content.  According to the authors, "Global and hemispheric mean surface temperatures show a significant dependence on solar irradiance at ? [wavelengths] > 250 nm" and "Reduction of irradiance at ? [wavelengths] > 250 nm leads to a significant (up to 2%) decrease in the ocean heat content (OHC) between 0 and 300 meters in depth, whereas the changes in irradiance at ? [wavelengths] < 250 nm or in energetic particles have virtually no effect." 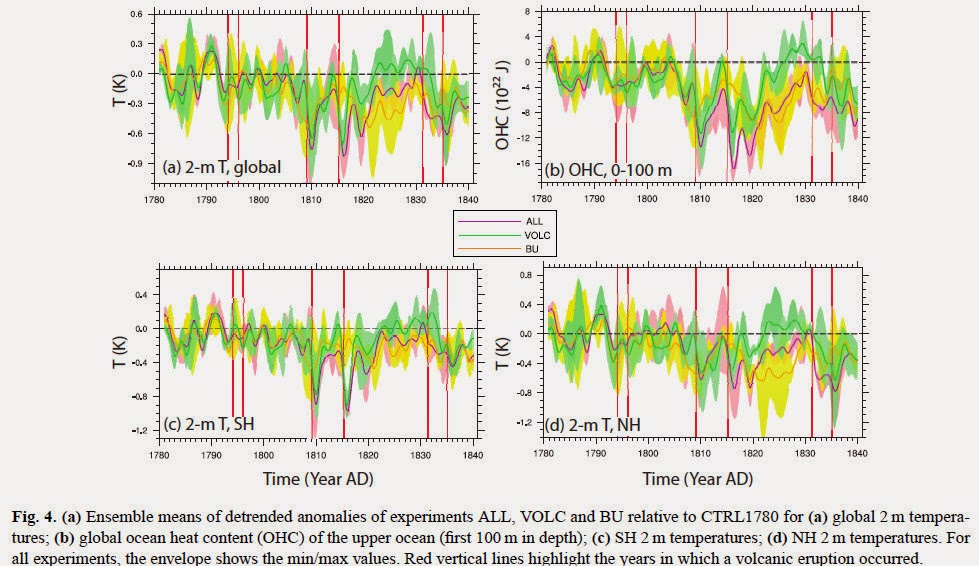 Global 2 meter temperature in upper left graph dropped ~0.8C during the Dalton Minimum. Ocean Heat Content 0-100 meters in upper right graph dropped ~16 x 10^22 Joules. The paper shows a ~16 x 10^22 Joule decrease in global ocean heat content from 0 to 100 meters during the Dalton Minimum, which by way of comparison is 3 times larger than the 5 x 10^22 Joule increase in global ocean heat content 0-100 meters over the past 55 years [Levitus et al 2012, figure 2]. The paper also shows a global surface temperature decrease of ~0.8C during the Dalton Minimum, by way of comparison about the same as the 0.7 - 0.8C global warming since the Little Ice Age ended in ~1850. Impact of solar versus volcanic activity variations on tropospheric temperatures and precipitation during the Dalton MinimumJ. G. Anet1, S. Muthers2,3, E. V. Rozanov1,4, C. C. Raible2,3, A. Stenke1, A. I. Shapiro4, S. Brönnimann3,5, F. Arfeuille3,5, Y. Brugnara3,5, J. Beer6, F. Steinhilber6, W. Schmutz4, and T. Peter1 1Institute for Atmospheric and Climate Science ETH, Zurich, Switzerland 2Climate and Environment Physics, Physics Institute, University of Bern, Bern, Switzerland 3Oeschger Centre for Climate Change Research, University of Bern, Bern, Switzerland 4Physikalisch-Meteorologisches Observatorium Davos and World Radiation Center (PMOD/WRC), Davos, Switzerland 5Institute of Geography, University of Bern, Bern, Switzerland 6Eawag, Surface Waters group, Dübendorf, Switzerland Abstract. The aim of this work is to elucidate the impact of changes in solar irradiance and energetic particles versus volcanic eruptions on tropospheric global climate during the Dalton Minimum (DM, AD 1780–1840). Separate variations in the (i) solar irradiance in the UV-C with wavelengths ? < 250 nm, (ii) irradiance at wavelengths ? > 250 nm, (iii) in energetic particle spectrum, and (iv) volcanic aerosol forcing were analyzed separately, and (v) in combination, by means of small ensemble calculations using a coupled atmosphere–ocean chemistry–climate model. Global and hemispheric mean surface temperatures show a significant dependence on solar irradiance at ? > 250 nm. Also, powerful volcanic eruptions in 1809, 1815, 1831 and 1835 significantly decreased global mean temperature by up to 0.5 K for 2–3 years after the eruption. However, while the volcanic effect is clearly discernible in the Southern Hemispheric mean temperature, it is less significant in the Northern Hemisphere, partly because the two largest volcanic eruptions occurred in the SH tropics and during seasons when the aerosols were mainly transported southward, partly because of the higher northern internal variability. In the simulation including all forcings, temperatures are in reasonable agreement with the tree ring-based temperature anomalies of the Northern Hemisphere. Interestingly, the model suggests that solar irradiance changes at ? < 250 nm and in energetic particle spectra have only an insignificant impact on the climate during the Dalton Minimum. This downscales the importance of top–down processes (stemming from changes at ? < 250 nm) relative to bottom–up processes (from ? > 250 nm). Reduction of irradiance at ? > 250 nm leads to a significant (up to 2%) decrease in the ocean heat content (OHC) between 0 and 300 m in depth, whereas the changes in irradiance at ? < 250 nm or in energetic particles have virtually no effect. Also, volcanic aerosol yields a very strong response, reducing the OHC of the upper ocean by up to 1.5%. In the simulation with all forcings, the OHC of the uppermost levels recovers after 8–15 years after volcanic eruption, while the solar signal and the different volcanic eruptions dominate the OHC changes in the deeper ocean and prevent its recovery during the DM. Finally, the simulations suggest that the volcanic eruptions during the DM had a significant impact on the precipitation patterns caused by a widening of the Hadley cell and a shift in the intertropical convergence zone. Paper link: www.clim-past.net/10/921/2014/cp-10-921-2014.htmlSchtick link: hockeyschtick.blogspot.co.uk/2014/05/new-paper-finds-8c-global-cooling.html |
|
|
|
Post by cuttydyer on May 15, 2014 8:10:45 GMT
New paper finds 'relatively high climate sensitivity' to tiny 0.1% changes in solar activity A paper published in Climate Dynamics finds the climate may be highly sensitive to tiny 0.1% changes in solar activity over solar cycles, producing temperature variations of as much as 0.5 to 1.0°C at the Antarctic "Vostok" station nearest the South Pole. By way of comparison, the globe has warmed only 0.7C over the past 164 years.  According to the authors, "Antarctic “Vostok” station works most closely to the center of the ice cap among permanent year-around stations. Climate conditions are exclusively stable: low precipitation level, cloudiness and wind velocity. These conditions can be considered as an ideal model laboratory to study the surface temperature response on solar irradiance variability during 11-year cycle of solar activity." "Using meteorological temperature record during (1958–2011) we calculated the HFD [heat flux density] variation about 0.2–0.3 W/m2 in phase with solar activity cycle. This HFD variation is derived from 0.5 to 1 °C temperature variation and shows relatively high climate sensitivity per 0.1 % of solar radiation change. This effect can be due to the polar amplification phenomenon, which predicts a similar response 0.3–0.8 °C/0.1 % (Gal-Chen and Schneider in Tellus 28:108–121, 1975)." Paper link: rd.springer.com/article/10.1007%2Fs00382-013-1925-3?utm_content=bufferfa222&utm_medium=social&utm_source=twitter.com&utm_campaign=bufferSchtick link: hockeyschtick.blogspot.co.uk/2014/05/new-paper-finds-relatively-high-climate.html |
|
|
|
Post by cuttydyer on May 15, 2014 8:35:03 GMT
Activity on the sun is sparking lightning strikes here on Earth, a study suggests. Scientists have found that when gusts of high-speed solar particles enter our atmosphere, the number of lightning bolts increases.  The research is published in the journal Environmental Research Letters. Because solar activity is closely monitored by satellites, it may now be possible to forecast when these hazardous storms will hit. Lead researcher Dr Chris Scott, from the University of Reading, said: "Lightning represents a significant hazard. "There's something like 24,000 people struck by lightning each year, so having any understanding or advanced warning of the severity of lightning storms has to be useful." Link: www.bbc.co.uk/news/science-environment-27406358 |
|
|
|
Post by cuttydyer on May 25, 2014 6:52:34 GMT
The Schtick reports: New paper finds natural variability of N Carolina climate explained by solar activity & AMO  A paper published today in Nonlinear Processes in Geophysics finds "the natural variability of climate change in NC [North Carolina] during 1950–2009 can be explained mostly by the AMO [Atlantic Multidecadal Oscillation] and solar activity." Prior papers have also found the AMO driven by solar activity. Climate scientists claim the tiny 0.1% variations in total solar irradiance over solar cycles cannot affect climate, but this paper and many others suggest that solar amplification mechanisms including via ocean oscillations can cause large scale effects on climate. Nonlin. Processes Geophys., 21, 605-615, 2014 www.nonlin-processes-geophys.net/21/605/2014/doi:10.5194/npg-21-605-2014 Trend analysis using non-stationary time series clustering based on the finite element method M. Gorji Sefidmazgi1, M. Sayemuzzaman2, A. Homaifar1, M. K. Jha3, and S. Liess4 1North Carolina A&T State University, Dept. of Electrical Engineering, Greensboro, USA 2North Carolina A&T State University, Dept. of Energy and Environmental Systems, Greensboro, USA 3North Carolina A&T State University, Dept. of Civil, Architectural and Environmental Engineering, Greensboro, USA 4University of Minnesota, Department of Soil, Water and Climate, St. Paul, USA Abstract. In order to analyze low-frequency variability of climate, it is useful to model the climatic time series with multiple linear trends and locate the times of significant changes. In this paper, we have used non-stationary time series clustering to find change points in the trends. Clustering in a multi-dimensional non-stationary time series is challenging, since the problem is mathematically ill-posed. Clustering based on the finite element method (FEM) is one of the methods that can analyze multidimensional time series. One important attribute of this method is that it is not dependent on any statistical assumption and does not need local stationarity in the time series. In this paper, it is shown how the FEM-clustering method can be used to locate change points in the trend of temperature time series from in situ observations. This method is applied to the temperature time series of North Carolina (NC) and the results represent region-specific climate variability despite higher frequency harmonics in climatic time series. Next, we investigated the relationship between the climatic indices with the clusters/trends detected based on this clustering method. It appears that the natural variability of climate change in NC [North Carolina] during 1950–2009 can be explained mostly by AMO and solar activity. Paper link: www.nonlin-processes-geophys.net/21/605/2014/npg-21-605-2014.htmlSchtick link: hockeyschtick.blogspot.co.uk/2014/05/new-paper-finds-natural-variability-of.html |
|
|
|
Post by nautonnier on May 25, 2014 11:22:38 GMT
The Schtick reports: New paper finds natural variability of N Carolina climate explained by solar activity & AMO The AMO defined by NOAA as: "The AMO is an ongoing series of long-duration changes in the sea surface temperature of the North Atlantic Ocean, with cool and warm phases that may last for 20-40 years at a time and a difference of about 1°F between extremes. These changes are natural and have been occurring for at least the last 1,000 years."North Carolina is adjacent to the Atlantic and can be expected to be affected by the temperatures along its eastern seaboard. The Sun (despite climatologist claims otherwise) will also be expected to have an effect based on cycle length and strength. Seems to be a long way around with lots of complex transforms to arrive at what a fisherman on the Outer Banks could have told them  |
|


