|
|
Post by missouriboy on Jan 14, 2017 5:45:39 GMT
I don't think so - you cannot tax the Sun, therefore zero interest. You may find that they are buying 'holiday homes' well outside the areas covered by the Laurentide ice sheet though Torch and pitchfork proof I presume.  |
|
|
|
Post by nautonnier on Jan 14, 2017 10:01:49 GMT
I don't think so - you cannot tax the Sun, therefore zero interest. You may find that they are buying 'holiday homes' well outside the areas covered by the Laurentide ice sheet though Torch and pitchfork proof I presume. Tar and feathers then torch and pitchfork  pour encourager les autres pour encourager les autres |
|
|
|
Post by sigurdur on Jan 14, 2017 14:26:03 GMT
For those with the time that are interested in solar mechanics, here is a video from the 2009 AGU meeting. Haven't finished it, but the first presentation provided a useful overview. www.youtube.com/watch?v=2pihNCFj_TMFrom the 2nd presentation I was struck by the following graph ... the long convex slope from 5500 BC peaks in about 100 AD and declines thereafter. Does this mean that following our current 100-year solar maximum we are unlikely to return to a comparable period for quite some time as we are on the downward sloping flank of the curve. I would think that would be of interest to our leaders as we, as a civilization, look to the future. The entire timeline of the sum of all our civilizations occupies a 'grand bump' along the path of solar time.  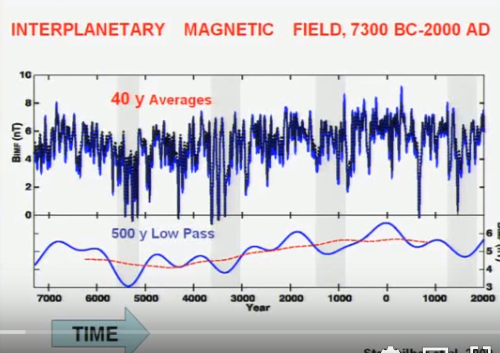 Remember MIS-11 |
|
|
|
Post by missouriboy on Jan 14, 2017 15:55:43 GMT
For those with the time that are interested in solar mechanics, here is a video from the 2009 AGU meeting. Haven't finished it, but the first presentation provided a useful overview. www.youtube.com/watch?v=2pihNCFj_TMFrom the 2nd presentation I was struck by the following graph ... the long convex slope from 5500 BC peaks in about 100 AD and declines thereafter. Does this mean that following our current 100-year solar maximum we are unlikely to return to a comparable period for quite some time as we are on the downward sloping flank of the curve. I would think that would be of interest to our leaders as we, as a civilization, look to the future. The entire timeline of the sum of all our civilizations occupies a 'grand bump' along the path of solar time. Remember MIS-11  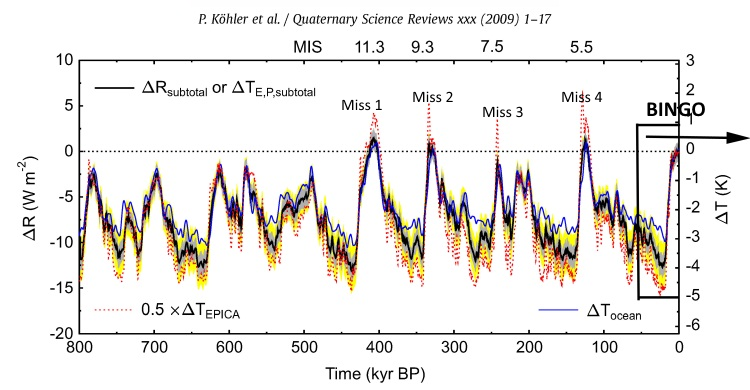 |
|
|
|
Post by missouriboy on Jan 26, 2017 16:34:30 GMT
This a good summary of many issues addressed on this blog on climate and its relationship to solar activity. As would be expected, he may be wrong or partially wrong on his analysis, but it's a good journalistic exercise, and he admits his slant. We will see.   I want his data network. www.youtube.com/watch?v=PYo9IvmD9mo |
|
anse
Level 2 Rank

Posts: 62
|
Post by anse on Jan 26, 2017 21:47:45 GMT
Anyone has any clue about what the neutron counters are telling lately ? I have not seen any link for a long time what I can remember, or I´ve simply missed it! Would be interesting to see what is going on since we are now heading for a solar minimum.
Speaking about solar minimum, I´ve heard that scientists now are thinking that minimum is due to 2019/2020, due to the current declince trend. Seems like they are still not realizing that we have left the grand maximum and entered into a kind of extended minimum, which also means longer solar cycles. Since cycle 23 was about 12,5 years, the current one will at least be equal, or most likely longer. With 12,5 years, we´ll end up with solar cycle 24 minimum in the middle of 2021.
|
|
|
|
Post by acidohm on Jan 26, 2017 22:10:43 GMT
Anyone has any clue about what the neutron counters are telling lately ? I have not seen any link for a long time what I can remember, or I´ve simply missed it! Would be interesting to see what is going on since we are now heading for a solar minimum. Speaking about solar minimum, I´ve heard that scientists now are thinking that minimum is due to 2019/2020, due to the current declince trend. Seems like they are still not realizing that we have left the grand maximum and entered into a kind of extended minimum, which also means longer solar cycles. Since cycle 23 was about 12,5 years, the current one will at least be equal, or most likely longer. With 12,5 years, we´ll end up with solar cycle 24 minimum in the middle of 2021. At this rate however, we'll be outta sunspots long before then! |
|
|
|
Post by missouriboy on Jan 26, 2017 22:55:25 GMT
Anyone has any clue about what the neutron counters are telling lately ? I have not seen any link for a long time what I can remember, or I´ve simply missed it! Would be interesting to see what is going on since we are now heading for a solar minimum. Speaking about solar minimum, I´ve heard that scientists now are thinking that minimum is due to 2019/2020, due to the current declince trend. Seems like they are still not realizing that we have left the grand maximum and entered into a kind of extended minimum, which also means longer solar cycles. Since cycle 23 was about 12,5 years, the current one will at least be equal, or most likely longer. With 12,5 years, we´ll end up with solar cycle 24 minimum in the middle of 2021. At this rate however, we'll be outta sunspots long before then! Try Amazon! |
|
|
|
Post by Ratty on Jan 27, 2017 0:08:18 GMT
This a good summary of many issues addressed on this blog on climate and its relationship to solar activity. As would be expected, he may be wrong or partially wrong on his analysis, but it's a good journalistic exercise, and he admits his slant. We will see. I want his data network. www.youtube.com/watch?v=PYo9IvmD9mo Don't be greedy, Missouri. I want your charting skills ...... |
|
|
|
Post by missouriboy on Jan 27, 2017 0:53:53 GMT
This a good summary of many issues addressed on this blog on climate and its relationship to solar activity. As would be expected, he may be wrong or partially wrong on his analysis, but it's a good journalistic exercise, and he admits his slant. We will see. I want his data network. www.youtube.com/watch?v=PYo9IvmD9mo Don't be greedy, Missouri. I want your charting skills ...... NO DATA ... NO CHARTS. |
|
|
|
Post by missouriboy on Jan 27, 2017 1:16:00 GMT
Anyone has any clue about what the neutron counters are telling lately ? I have not seen any link for a long time what I can remember, or I´ve simply missed it! Would be interesting to see what is going on since we are now heading for a solar minimum. Speaking about solar minimum, I´ve heard that scientists now are thinking that minimum is due to 2019/2020, due to the current declince trend. Seems like they are still not realizing that we have left the grand maximum and entered into a kind of extended minimum, which also means longer solar cycles. Since cycle 23 was about 12,5 years, the current one will at least be equal, or most likely longer. With 12,5 years, we´ll end up with solar cycle 24 minimum in the middle of 2021. At this rate however, we'll be outta sunspots long before then! Solar cycles 22, 23 and 24 are plotted below so that their first month starts in the first month of SC23, the longest in the 3-cycle series, which began in May, 1996. SC22 was 122 months long. SC23 was 140 months long. If SC24 is the same length as SC23, it will end in August, 2019. I don't remember 2003 to 2006 being as wild as 2013 to 2016. I hope the data collection machinery is running overtime. 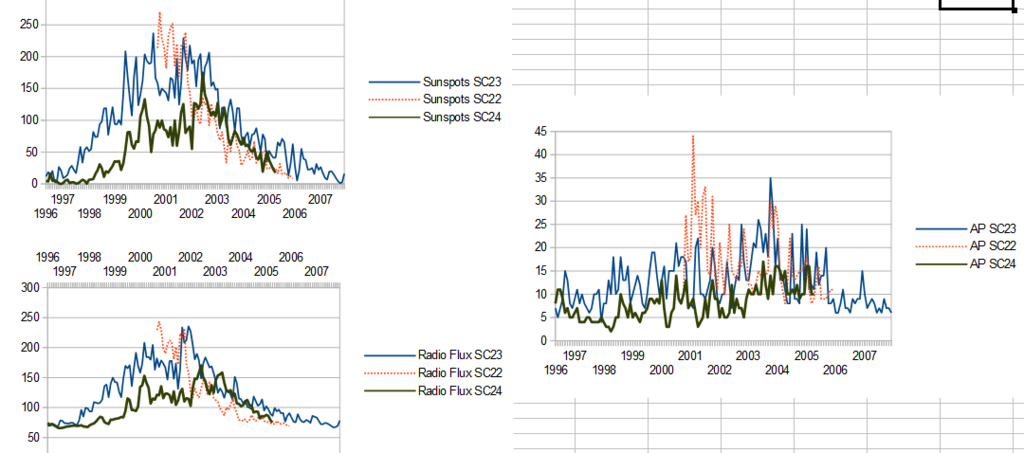 |
|
|
|
Post by missouriboy on Jan 27, 2017 10:53:50 GMT
Either this same or similar article has been posted here before. But while reading the comments on 'wind-driven up-welling' article on Watts. the name of Stephen Wilde comes up again with a link. Posted by Stephen Wilde of course. And I read it again. And it makes incrementally more sense this time than last time. So here it is again. It seems to have the makings of one of those grand theories within which CO2 could go back to being a fertilizer. joannenova.com.au/2015/01/is-the-sun-driving-ozone-and-changing-the-climate/The central mystery in climate science is the Sun. The direct energy from the 1.4 million-kilometer-wide flaming ball stays remarkably constant. The radiation pours down on us but the relentless sameness of the watts can’t be causing of the swings in temperature on Earth. Something else is going on with the Sun. For one thing, the total light energy coming off the Sun stays almost the same but the type of light changes — the spectrum shifts – with more shorter wavelengths at one point in the cycle and longer wavelengths at the opposite part of the cycle. These have different effects. Shorter wavelengths (UV) generate ozone in the stratosphere and penetrate the ocean. Longer wavelengths don’t. But the Sun is also sending out charged particles and driving a massive fluctuating magnetic field, both of which affect Earth’s atmosphere.Summary of the Stephen Wilde Hypothesis In essence: The Sun affects the ozone layer through changes in UV or charged particles. When the Sun is more active there is more ozone above the equator and less over the poles, and vice versa. An increase in ozone warms the stratosphere or mesosphere, which pushes the tropopause lower. There is thus a solar induced see-saw effect on the height of the tropopause, which causes the climate zones to shift towards then away from the equator, moving the jet streams and changing them from “zonal” jet streams to “meridonal” ones. When meridonal, the jet streams wander in loops further north and south, resulting in longer lines of air mass mixing at climate zone boundaries, which creates more clouds. Clouds reflect sunlight back out to space, determining how much the climate system is heated by the near-constant incoming solar radiation. Thus the Sun’s UV and charged particles modulate the solar heating of the Earth.
Inactive Sun, ozone, UV, climate 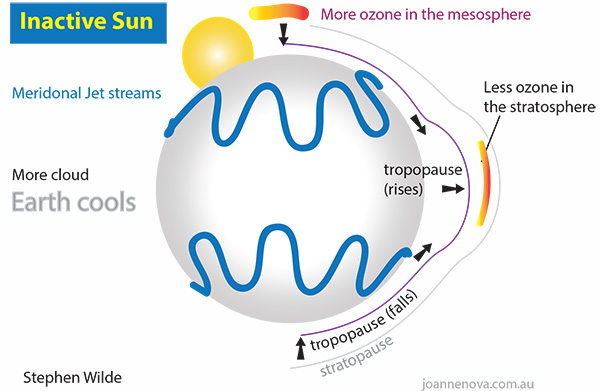 Figure 1: When the Sun is less active there is more ozone at the poles but less over the equator. Less ozone above the tropopause causes less stratospheric warming, allowing the tropopause up, which pushes the climate zones towards the equator. This causes the jet streams to be more meridonal, so more clouds are formed. Clouds reflect sunlight, so less solar radiation warms the Earth. An active Sun increases ozone in the stratosphere: “Changes in solar ultraviolet spectral irradiance directly modify the production rate of ozone in the upper stratosphere (e.g. Brasseur, 1993), and hence it is reasonable to expect a solar cycle variation in ozone amount. The global satellite ozone records since 1979 show evidence for a decadal oscillation of total ozone with maximum amplitude (~2%) at low latitudes (Hood and McCormack, 1992; Chandra and McPeters, 1994; Hood, 1997). wilde, ozone, UV, sun, climate, tropopause 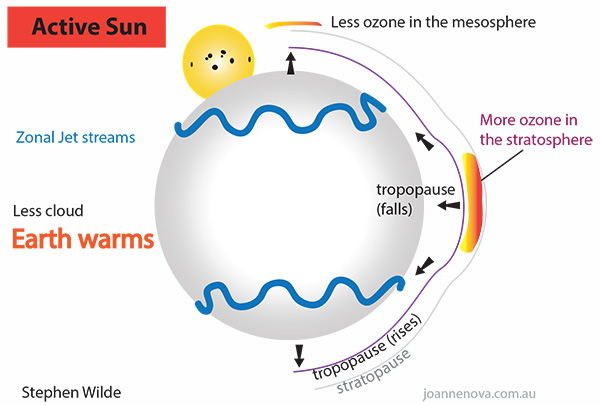 Figure 2: When the Sun is more active there is less ozone at the poles but more over the equator. More ozone above the tropopause causes more stratospheric warming, forcing the tropopause down, which pushes the climate zones away from the equator. This causes the jet streams to be more zonal, so fewer clouds are formed. Clouds reflect sunlight, so more solar radiation warms the Earth. |
|
|
|
Post by Ratty on Jan 27, 2017 11:47:05 GMT
FWIW and absolutely understanding that you do not need to be a climate "scientist" to do the research, here is some info (?) on Stephen Wilde: The Climate Denier List |
|
|
|
Post by nautonnier on Jan 27, 2017 12:54:18 GMT
Either this same or similar article has been posted here before. But while reading the comments on 'wind-driven up-welling' article on Watts. the name of Stephen Wilde comes up again with a link. Posted by Stephen Wilde of course. And I read it again. And it makes incrementally more sense this time than last time. So here it is again. It seems to have the makings of one of those grand theories within which CO2 could go back to being a fertilizer. joannenova.com.au/2015/01/is-the-sun-driving-ozone-and-changing-the-climate/The central mystery in climate science is the Sun. The direct energy from the 1.4 million-kilometer-wide flaming ball stays remarkably constant. The radiation pours down on us but the relentless sameness of the watts can’t be causing of the swings in temperature on Earth. Something else is going on with the Sun. For one thing, the total light energy coming off the Sun stays almost the same but the type of light changes — the spectrum shifts – with more shorter wavelengths at one point in the cycle and longer wavelengths at the opposite part of the cycle. These have different effects. Shorter wavelengths (UV) generate ozone in the stratosphere and penetrate the ocean. Longer wavelengths don’t. But the Sun is also sending out charged particles and driving a massive fluctuating magnetic field, both of which affect Earth’s atmosphere.Summary of the Stephen Wilde Hypothesis In essence: The Sun affects the ozone layer through changes in UV or charged particles. When the Sun is more active there is more ozone above the equator and less over the poles, and vice versa. An increase in ozone warms the stratosphere or mesosphere, which pushes the tropopause lower. There is thus a solar induced see-saw effect on the height of the tropopause, which causes the climate zones to shift towards then away from the equator, moving the jet streams and changing them from “zonal” jet streams to “meridonal” ones. When meridonal, the jet streams wander in loops further north and south, resulting in longer lines of air mass mixing at climate zone boundaries, which creates more clouds. Clouds reflect sunlight back out to space, determining how much the climate system is heated by the near-constant incoming solar radiation. Thus the Sun’s UV and charged particles modulate the solar heating of the Earth.
Inactive Sun, ozone, UV, climate Figure 1: When the Sun is less active there is more ozone at the poles but less over the equator. Less ozone above the tropopause causes less stratospheric warming, allowing the tropopause up, which pushes the climate zones towards the equator. This causes the jet streams to be more meridonal, so more clouds are formed. Clouds reflect sunlight, so less solar radiation warms the Earth. An active Sun increases ozone in the stratosphere: “Changes in solar ultraviolet spectral irradiance directly modify the production rate of ozone in the upper stratosphere (e.g. Brasseur, 1993), and hence it is reasonable to expect a solar cycle variation in ozone amount. The global satellite ozone records since 1979 show evidence for a decadal oscillation of total ozone with maximum amplitude (~2%) at low latitudes (Hood and McCormack, 1992; Chandra and McPeters, 1994; Hood, 1997). wilde, ozone, UV, sun, climate, tropopause Figure 2: When the Sun is more active there is less ozone at the poles but more over the equator. More ozone above the tropopause causes more stratospheric warming, forcing the tropopause down, which pushes the climate zones away from the equator. This causes the jet streams to be more zonal, so fewer clouds are formed. Clouds reflect sunlight, so more solar radiation warms the Earth. I had a discussion of this a while back with Stephen as I do not believe that it is an 'ozone push' that changes levels of the troposphere, it is the strength of the convective Hadley cells which will increase as ocean surface warms causing more evaporation and convective uplift. Like turning on a gas burner under a pan of near boiling water you will see the water 'welling' up where the heat is. The Hadley cells get more vigorous and expand poleward - and you have the same effect that Stephen shows with meridonal jetstreams moving poleward, the polar jet becomes more vigorous and almost circular and the polar cold is kept contained at the poles. We currently are seeing the opposite with longer wavelengths from the sun which fail to warm the ocean as they do not penetrate into the water, convection reduces and the jetstreams for looping Rossby waves and are latitudinal. Of course both Stephen and I could be right and both effects reinforce each other. Now link that to the wind causing upwelling theories and you can see how the latitudinal jetstreams could result in different wind patterns leading to different ocean upwelling patterns. A hypothesis could be that the solar change to longer wavelengths, results in changes in the ozone layer and reduction in surface ocean heating. The reduction in surface heating is reinforced by wind changes that force more upwelling of colder water which is then not warmed due to the lower wavelength solar output. This in turn leads to cold 'blobs' as in North Atlantic and North Pacific. The weakened latitudinal jetstreams allow polar air to move equatorward all of these adding together to cause significant drops in atmospheric temperatures. An indicator of this cooling reinforcement starting would be a reduction in ACE and lower numbers of cyclones and hurricanes - which is just what we are seeing now. |
|
|
|
Post by missouriboy on Jan 27, 2017 12:57:08 GMT
FWIW and absolutely understanding that you do not need to be a climate "scientist" to do the research, here is some info (?) on Stephen Wilde: The Climate Denier ListThanks Ratty. I had not read the linked article before. Seems to me that the above thesis should be readily falsifiable given the satellite data we have since 1979 AND the period we are going through now. They should be perhaps a tiny bit less haughty given the growing 'reputation' of the climate scientist club. I think it may have passed the 'timeshare salesman' level. By the way ... I didn't see your name on that list. I think you should protest! |
|


 pour encourager les autres


 I want his data network.
