|
|
Post by glennkoks on Jul 31, 2013 13:14:32 GMT
Another thought.
If the current lull in solar activity is indeed effecting Rossby Waves and making them more latitudinal and we are at or near the peak of solar cycle 24 what is going to happen when we hit the bottom?
Or heaven forbids Solar Cycle 25 is a low as many or predicting or even non existent?
|
|
|
|
Post by cuttydyer on Jul 31, 2013 13:56:19 GMT
Another thought. If the current lull in solar activity is indeed effecting Rossby Waves and making them more latitudinal and we are at or near the peak of solar cycle 24 what is going to happen when we hit the bottom? Or heaven forbids Solar Cycle 25 is a low as many or predicting or even non existent? I'm currently reading Professor (anthropology, University of California) Brian f*gan's "The Little Ice Age"; today's extremes of weather are looking uncomfortably similar to those experienced during previous historic periods of low solar activity.  Cycle 25 if as low as projected has the potential to create havoc... |
|
|
|
Post by sigurdur on Jul 31, 2013 14:09:45 GMT
I agree with you Cutty. Looked at some recent proxy type data concerning the area I farm in....and if Solar Cycle 25 is a doozy.....it portends for some deff risk analysis.
|
|
|
|
Post by glennkoks on Jul 31, 2013 15:38:12 GMT
cutty,
I just orded that book on Ebay. Thanks for the review. I have always been interested in the transition from the MWP to LIA and the conditions that prevailed in that time.
|
|
|
|
Post by cuttydyer on Aug 6, 2013 8:29:39 GMT
Why scientists are skeptical about the anthropogenic global warming hypothesisA new peer-reviewed paper published in Energy & Environment: Arthur Rörsch, Peter A. Ziegler1 The Netherlands 2 Switzerland  Abstract: The strong climate-forcing effect of rising atmospheric CO2 concentrations advocated by the IPCC, is at odds with climate developments during geological, historical and recent times. Although atmospheric CO2 concentrations continuously increased during industrial times, temperatures did not increase continuously to the present level but stagnated or even declined slightly during 1880 to 1900, 1945 to 1977 and again since 1998. Total solar irradiation rose from a low in 1890 to a first peak in 1950 that was followed by a sharp decline ending in 1977, giving way to a period of rapidly increasing radiation peaking in 2002 when solar activity started to decrease, possibly declining to a new Little-Ice-Age type low. The Greenhouse Effect of increasing atmospheric CO2 concentrations, claimed and widely propagated by IPCC, is particularly vexing as it is widely over-estimated without adequate scientific justification. Large observed climate variations documented for geological and historical times, as well as the lack of insight into the behaviour of complex systems, seriously question the Anthropogenic Global Warming (AGW) concept propagated by the IPCC. The climate variability during industrial times was essentially governed by changes in solar activity with increasing atmospheric CO2 content playing a subordinate role. The climate controlling effect attributed by the IPCC to increasing atmospheric CO2 concentrations is rejected since supporting models are not compatible with observations. Lastly, the authors consider from a historical and philosophical science point of view why current mainstream climate change research and IPCC assessments may have been on an erring way for several decades. Paper link: principia-scientific.org/images/stories/pdfs/UNKNOWN_PARAMETER_VALUE.pdfSchtick link: hockeyschtick.blogspot.co.uk/2013/08/why-scientists-are-skeptical-about.html
|
|
|
|
Post by magellan on Aug 7, 2013 18:36:22 GMT
|
|
|
|
Post by trbixler on Aug 10, 2013 1:17:24 GMT
"Major Danish Daily Warns: “Globe May Be On Path To Little Ice Age…Much Colder Winters…Dramatic Consequences”!" 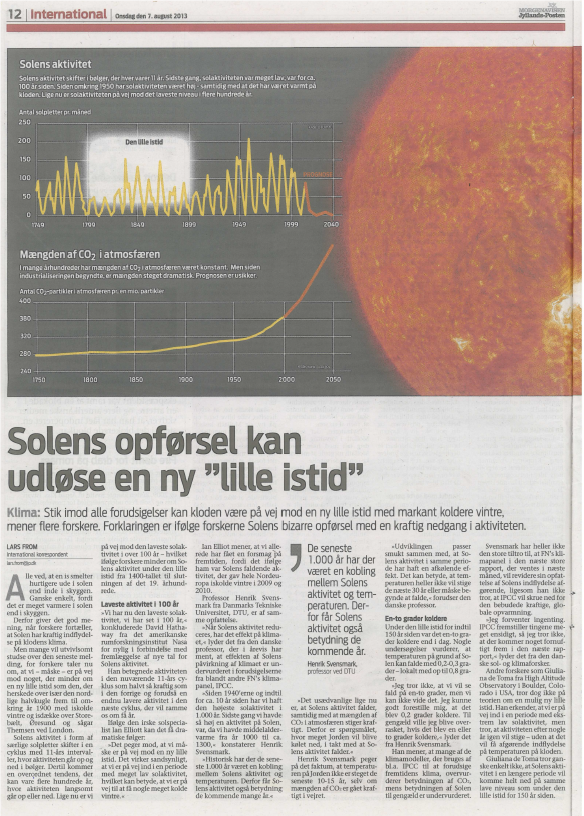 "Another major European media outlet is asking: Where’s the global warming? Image right: The August 7 edition of Denmark’s Jyllands-Posten, featured a major 2-page article on the globe’s 15-years of missing warming and the potential solar causes and implications. Moreover, they are featuring prominent skeptic scientists who are warning of a potential little ice age and dismissing CO2 as a major climate driver. And all of this just before the release of the IPCC’s 5AR, no less!" link |
|
|
|
Post by sigurdur on Aug 10, 2013 3:08:30 GMT
Thanks TR. I have to agree with what I read in the article.
|
|
|
|
Post by cuttydyer on Aug 12, 2013 9:37:22 GMT
The Schtick reports: New paper predicts solar activity will decline over 21st century to average Holocene levels A paper published today in Climate of the Past reconstructs solar activity over the Holocene [past 10,000 years] and finds solar activity during the 20th century was at relatively high levels in comparison to the rest of the Holocene, but that "Solar activity is during 28% of the time higher than the modern average (650 MeV), but the absolute values remain weakly constrained due to uncertainties in the normalisation of the solar modulation to instrumental data." The authors predict solar activity will decrease in the 21st century, stating, "Autoregressive modelling suggests a declining trend of solar activity in the 21st century towards average Holocene conditions."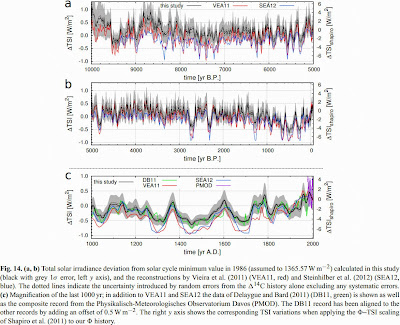 Reconstructed Total Solar Irradiance [TSI] over the Holocene 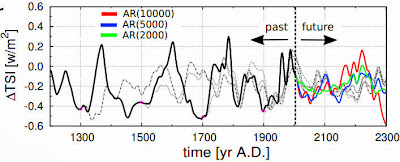 Future solar activity is predicted to decline to "average Holocene conditions" R. Roth and F. Joos Climate and Environmental Physics, Physics Institute, University of Bern, Bern, Switzerland Oeschger Centre for Climate Change Research, University of Bern, Bern, Switzerland Abstract. Radiocarbon production, solar activity, total solar irradiance (TSI) and solar-induced climate change are reconstructed for the Holocene (10 to 0 kyr BP), and TSI is predicted for the next centuries. The IntCal09/SHCal04 radiocarbon and ice core CO2 records, reconstructions of the geomagnetic dipole, and instrumental data of solar activity are applied in the Bern3D-LPJ, a fully featured Earth system model of intermediate complexity including a 3-D dynamic ocean, ocean sediments, and a dynamic vegetation model, and in formulations linking radiocarbon production, the solar modulation potential, and TSI. Uncertainties are assessed using Monte Carlo simulations and bounding scenarios. Transient climate simulations span the past 21 thousand years, thereby considering the time lags and uncertainties associated with the last glacial termination. Our carbon-cycle-based modern estimate of radiocarbon production of 1.7 atoms cm?2 s?1 is lower than previously reported for the cosmogenic nuclide production model by Masarik and Beer (2009) and is more in-line with Kovaltsov et al. (2012). In contrast to earlier studies, periods of high solar activity were quite common not only in recent millennia, but throughout the Holocene. Notable deviations compared to earlier reconstructions are also found on decadal to centennial timescales. We show that earlier Holocene reconstructions, not accounting for the interhemispheric gradients in radiocarbon, are biased low. Solar activity is during 28% of the time higher than the modern average (650 MeV), but the absolute values remain weakly constrained due to uncertainties in the normalisation of the solar modulation to instrumental data. A recently published solar activity–TSI relationship yields small changes in Holocene TSI of the order of 1 W m?2 with a Maunder Minimum irradiance reduction of 0.85 ± 0.16 W m?2. Related solar-induced variations in global mean surface air temperature are simulated to be within 0.1 K. Autoregressive modelling suggests a declining trend of solar activity in the 21st century towards average Holocene conditions. Paper pdf link: www.clim-past.net/9/1879/2013/cp-9-1879-2013.pdfSchtick link: hockeyschtick.blogspot.co.uk/2013/08/new-paper-predicts-solar-activity-will.html |
|
|
|
Post by cuttydyer on Aug 16, 2013 8:31:55 GMT
|
|
|
|
Post by cuttydyer on Aug 16, 2013 9:21:03 GMT
Daedal Earth reports on the paper: "Recent variability of the solar spectral irradiance and its impact on climate modelling" Abstract. The lack of long and reliable time series of solar spectral irradiance (SSI) measurements makes an accurate quantification of solar contributions to recent climate change difficult. Whereas earlier SSI observations and models provided a qualitatively consistent picture of the SSI variability, recent measurements by the SORCE (SOlar Radiation and Climate Experiment) satellite suggest a significantly stronger variability in the ultraviolet (UV) spectral range and changes in the visible and near-infrared (NIR) bands in anti-phase with the solar cycle. … Fig. 1. The solar spectral irradiance as inferred from SORCE and TIMED observations only, from 22 April 2004 till 23 July 2010. (A) shows the average solar spectral irradiance for that period. A black-body model has been used to extend the SSI for wave lengths beyond 1580nm. (B) displays the characteristic altitude of absorption in the Earth’s atmosphere for each wavelength, defined as the altitude at which the optical depth equals one. (C) shows the relative variability (peak to peak/average) for solar cycle variations inferred from measurements obtained between 22 April 2004 and 23 July 2010. Spectral regions, where the variability is in phase with the solar cycle (represented by, e.g. the sunspot number or the TSI) are marked in red, while blue denotes ranges where the variability measured by SORCE is out-of-phase with the solar cycle. These phases, as well as the magnitude of the variability in the UV, are not all reproduced by models and other observations (see Sect. 3 as well as Figs. 2, 7 and 8), and thus should be considered with care. (D) shows the absolute variability, which peaks strongly in the near-UV. Daedal comment: This paper tends to throw a hawk into a flock of roosting pigeons over their nice neat concept of solar TSI being a simple radiative energy source, instead of a complex body linking in many more ways with earth. This paper does not touch magnetic, which is a critical linkage. A known confounding effect is the contradiction of sunspot darkening reducing irradiance at the same time as an increase of harder radiation from the periphery. As an intense hot body there are still unknowns about the reason for the particular irradiance shape, Wien law, UV catastrophe and so on yet there are many temperatures involved, the sun is approximated. We can only view the sun through a fog anyway, near space rather than deep space. The poor data is covered, instrumentation which unfortunately was not as good as hoped. Paper link: www.atmos-chem-phys.net/13/3945/2013/acp-13-3945-2013.htmlDaedal link: daedalearth.wordpress.com/2013/08/13/spectral-irradiance-phasing-tsi-does-not-fit-common-assumptions-earth-is-affected/ |
|
|
|
Post by throttleup on Aug 16, 2013 14:09:22 GMT
Cutty,
I have heard that although the aggregate TSI is about the same, the UV bands are lower than normal.
Do you know a link or resource (or a chart!) that would discuss or illustrate that?
Many thanks in advance if you do...
|
|
|
|
Post by cuttydyer on Aug 16, 2013 14:44:32 GMT
Cutty,
I have heard that although the aggregate TSI is about the same, the UV bands are lower than normal.
Do you know a link or resource (or a chart!) that would discuss or illustrate that?
Many thanks in advance if you do...
TUp, The University of Colorado's Solar Spectral Irradiance Data page may be of interest: lasp.colorado.edu/home/sorce/data/ssi-data/Data description: The SORCE SOLSTICE, SIM, and XPS instruments together provide measurements of the full-disk Solar Spectral Irradiance (SSI) from 0.1 nm to 2400 nm (excluding 34-115 nm, which is not covered by the SORCE instruments). The two SOLSTICE instruments measure spectral irradiance from 115 nm to 310 nm with a resolution of 1 nm, the SIM instrument measures spectral irradiance from 310 nm to 2400 nm with a resolution varying from 1 to 34 nm, and the XPS instrument measures six broadband samples from 0.1 to 34 nm and at Lyman-alpha (121.6 nm). Measurements from these instruments are combined into merged daily and 6-hourly* spectra (*6-hourly data is currently available for the XPS instrument only and may be available from the other spectral instruments in the future), each containing representative irradiances reported on a uniform wavelength scale, which varies from 1-34 nm over the entire spectral interval. Irradiances are reported at a mean solar distance of 1 astronomical unit (AU) with units of W/m2/nm. Historical TSI Reconstruction:  Link: lasp.colorado.edu/home/sorce/data/tsi-data/___________________________________________________________________ Dr Abdussamatov demonstrates a correlation between TSI and sunspot activity: ?yclic variations of the TSI for the period of Nov, 16 1978 – March, 1 2010 (www.pmodwrc.ch/pmod.php?topic=tsi/composite/SolarConstant; Abdussamatov H.I. Kinematics and Physics of Celestial Bodies. 2005, 21, 328; (KPhCB). 2007, 23, 97; Abdussamatov H.I. The Sun Dictates the Climate. Fourth International Conference on Climate Change in Chicago, May 2010: www.heartland.org/environmentandclimate-news.org/ClimateConference4) Variations in the TSI (daily data are taken from www.pmodwrc.ch/pmod.php?topic=tsi/composite/SolarConstant ) and sunspot number (monthly data taken from sidc.oma.be/sunspot-data/) (Abdussamatov H.I. Kinematics and Physics of Celestial Bodies. 2005, 21, 328; Abdussamatov H.I. The Sun Dictates the Climate. Fourth International Conference on Climate Change in Chicago, May 2010: www.heartland.org/environmentandclimate-news.org/ClimateConference4) Link to paper: www.gao.spb.ru/english/astrometr/index1_eng.html |
|
|
|
Post by sigurdur on Aug 16, 2013 20:22:22 GMT
Don't know a lot about the sun........however:
1. The TSI variation differs between the two graphs.
2.5 verses 2.15. This is approx 14.9% difference.
Very substantial when talking about minute changes.
Take?
|
|
|
|
Post by georgebaxter on Aug 17, 2013 9:43:35 GMT
The TSI is an interesting metric. The problem is how to explain large terrestrial changes with variations of less than a tenth of a percent. My view is that different components of the sun's spectrum drives different part the earth's. It is becoming clear that the solar cycle is significant, but there is no obvious and direct causal relationship. Everyone is looking for direct and essentially linear and modellable changes. But what about threshholds in chaotic systems? The climate does show large swings, over geological time. That is a signature of a chaotic system. If there are several disparate drivers of the climate ( external solar cycles, TSI, wind, magnetic field, cosmic rays, etc, and internal cloud cover, oceanic currents, volcanic activity ) then it is hardly surprising that it is difficult to model. When a chaotic system changes state, from one quasi-stable state to another, it will often does so with little or no warning. To that end, the temperature of the high Arctic may be showing signs of a switch. ![]()  Danish Centre for Ocean and Ice Danish Centre for Ocean and Ice The temperature staibilty of the high Arctic is remarkable. It tends to reach zero C within a day or two every year, and fall below zero with the same regularity. Except things seem ro be changing since 2004. Slight wobbles appeared, late zero crossing and slightly below average for almost all of the time. This year is significanlty different. The rise about zero was two weeks late, and most of the time it was 1 or more degrees below average. The normal variation is 0.1 C. Now is falling away below zero at least a week early, and at a rather sharp rate. The winters in Northenn Europe have been decidedly chilly, especially 2010. It looks to me as though the Mander minimum is showing the first signs. The cimate is about to switch to another state, with lower Arctic temperatures. Don't let anyone tell you the Arctic temperatures are rising! ![]() |
|


