|
|
Post by acidohm on Jul 18, 2018 4:40:17 GMT
3 weeks since we had a sunspot....
|
|
|
|
Post by missouriboy on Jul 18, 2018 14:12:22 GMT
This chart is only through June. So the current uptick in spotless days may match or exceed March, which was the largest so far. Take a hitch in your suspenders. It could be a bumpy ride.  Next two years should tell quite a story. Their SC10-15 period spans 1860 to 1920 and includes the great winters of the 1870s, 1880s and 1890s, with two large cycles on the front end. sidc.be/silso/spotlessCREDIT: (SILSO data/image, Royal Observatory of Belgium, Brussels) 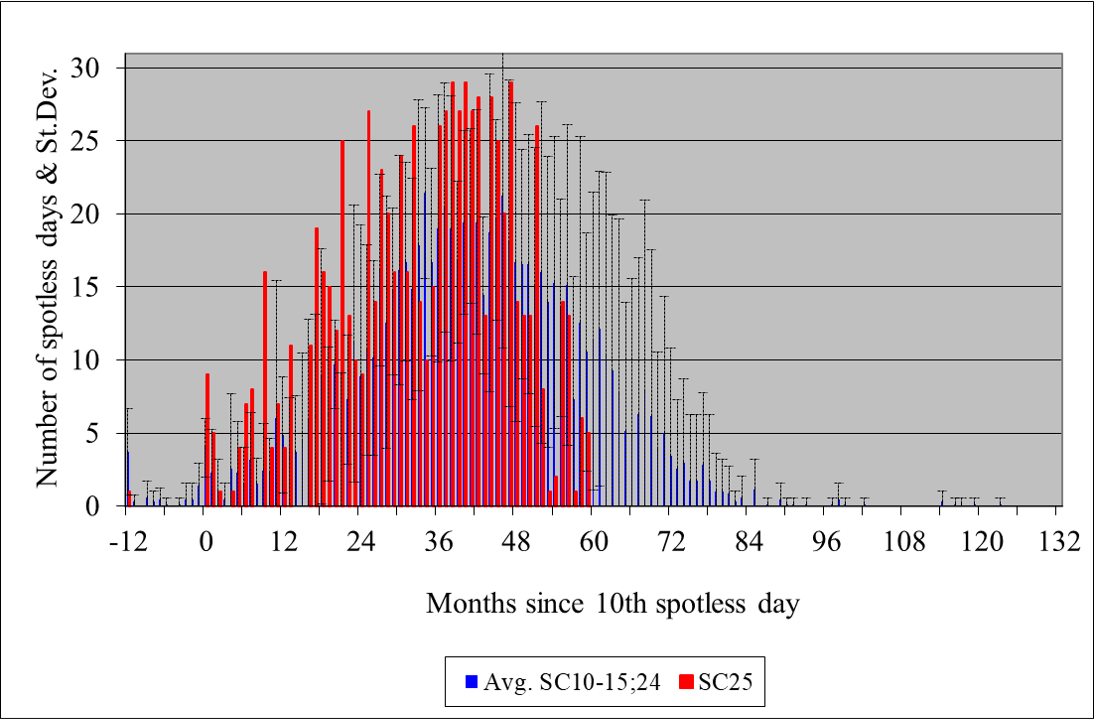   |
|
|
|
Post by missouriboy on Jul 23, 2018 1:40:40 GMT
|
|
|
|
Post by acidohm on Jul 23, 2018 4:35:36 GMT
|
|
|
|
Post by sigurdur on Jul 26, 2018 2:12:54 GMT
|
|
|
|
Post by blustnmtn on Aug 2, 2018 12:42:27 GMT
The blank stare has abated! It's pretty little though.

|
|
|
|
Post by Ratty on Aug 2, 2018 12:47:05 GMT
The blank stare has abated! It's pretty little though. So, is it meaningful ..... or are we still gonna die? |
|
|
|
Post by blustnmtn on Aug 2, 2018 13:00:17 GMT
The blank stare has abated! It's pretty little though. So, is it meaningful ..... or are we still gonna die? Death is inevitable and resistance is futile Ratty  Have a nice day! |
|
|
|
Post by missouriboy on Aug 2, 2018 16:01:49 GMT
The professional line at the CO2 cocktail party continues to dwindle it seems. When does the reverend Jim Phil Jones start spiking the punch? |
|
|
|
Post by missouriboy on Aug 4, 2018 23:20:05 GMT
|
|
|
|
Post by Ratty on Aug 16, 2018 7:55:30 GMT
Harmonic Analysis of Worldwide Temperature Proxies for 2000 YearsAbstractThe Sun as climate driver is repeatedly discussed in the literature but proofs are often weak. In order to elucidate the solar influence, we have used a large number of temperature proxies worldwide to construct a global temperature mean G7 over the last 2000 years. The Fourier spectrum of G7 shows the strongest components as ~1000-, ~460-, and ~190 - year periods whereas other cycles of the individual proxies are considerably weaker. The G7 temperature extrema coincide with the Roman, medieval, and present optima as well as the well-known minimum of AD 1450 during the Little Ice Age. We have constructed by reverse Fourier transform a representation of G7 using only these three sine functions, which shows a remarkable Pearson correlation of 0.84 with the 31-year running average of G7. The three cycles are also found dominant in the production rates of the solar-induced cosmogenic nuclides 14C and 10Be, most strongly in the ~190 - year period being known as the De Vries/Suess cycle. By wavelet analysis, a new proof has been provided that at least the ~190-year climate cycle has a solar origin. DISCUSSION / CONCLUSIONThe Fourier spectrum of a global temperature record G7, composed of high quality temperature proxies worldwide and recent instrumental data demonstrate the dominance of three climate cycles with ~1000 (Eddy cycle), ~460 (not named but frequently reported), and ~190 year periods (De Vries/Suess cycle). These three sines represent the 31-year running mean of G7 with the remarkable Pearson correlation of 0.84 indicating their importance for climate. G7, and likewise the sine representations have maxima of comparable size at AD 0, 1000, and 2000. We note that the temperature increase of the late 19th and 20th century is represented by the harmonic temperature representation, and thus is of pure multiperiodic nature. It can be expected that the periodicity of G7, lasting 2000 years so far, will persist also for the foreseeable future. It predicts a temperature drop from present to AD 2050, a slight rise from 2050 to 2130, and a further drop from AD 2130 to 2200 (see Fig. 3), upper panel, green and red curves). As a main result of our study, the construction of a global record G7 from numerous temperature proxies reduces noise and thus allows the isolation of these global cycles. The dominance of the significant frequency components in the G7 spectrum, as opposed to the strength of other components in the spectra of the individual proxy records supports this view. We provide a new confirmation for the link between solar activity and climate cycles by wavelet analysis showing a remarkably good agreement of the power of the ~190 - year period for temperatures and solar activity over 9000 years (see Fig. 4 lower panel). As (Fig. 2 and Table 2) show, the periods of ~1000 and ~460 years are also apparently common in records of temperatures and cosmogenic nuclides.
|
|
|
|
Post by icefisher on Aug 16, 2018 19:14:37 GMT
This is an excellent article on essentially the Milankovich cycles. Very well documented so while complex the excellent diagrams and explanations of sources makes it readable by an amateur. For the first time I think I understand how those cycles actually relate to long term climate variation. judithcurry.com/2018/08/14/nature-unbound-x-the-next-glaciation/ |
|
|
|
Post by blustnmtn on Aug 16, 2018 19:31:38 GMT
This is an excellent article on essentially the Milankovich cycles. Very well documented so while complex the excellent diagrams and explanations of sources makes it readable by an amateur. For the first time I think I understand how those cycles actually relate to long term climate variation. judithcurry.com/2018/08/14/nature-unbound-x-the-next-glaciation/I agree Ice! I posted the same link in : “Is an ice age coming” |
|
|
|
Post by missouriboy on Aug 28, 2018 12:11:44 GMT
|
|
|
|
Post by Ratty on Aug 28, 2018 13:07:48 GMT
OMG! The dog ate my homework on Thursday night ... late .... while I was still sleeping. Mongrel !! 
|
|


 Next two years should tell quite a story. Their SC10-15 period spans 1860 to 1920 and includes the great winters of the 1870s, 1880s and 1890s, with two large cycles on the front end.


 Have a nice day!
