|
|
Post by nonentropic on May 31, 2013 7:35:51 GMT
some air has moved around ha.
but blocking highs are the big story and in a lot of places.
is there a blocking high proxy so we an see if there are long term periods of this phenomena.
I do remember some discussion of some very warms spells during the LIA that may have been functionally driven by blocking systems
|
|
|
|
Post by numerouno on May 31, 2013 12:05:12 GMT
Temps surpass +30C in the farthest Finnish north today. A new all-time record daytime high for the location in May.  |
|
|
|
Post by numerouno on Jun 1, 2013 18:08:37 GMT
A new all-time high for June temps is reality in Utsjoki-Kevo today, +31.1C (previous record was +29.2C, Jun 25th, 1990).
EDIT the new record is now +31.7C
|
|
|
|
Post by glennkoks on Jun 2, 2013 17:01:29 GMT
numerouno,
Does this new high fall under the category of "weather" or "climate change"?
|
|
|
|
Post by nautonnier on Jun 2, 2013 19:47:48 GMT
Its weather in the same way that the Pyrenees are weather link |
|
|
|
Post by sigurdur on Jun 2, 2013 20:17:05 GMT
Glad to see that Finland is warm. I am sure it is appreciated.
|
|
|
|
Post by icefisher on Jun 2, 2013 20:43:16 GMT
A new all-time high for June temps is reality in Utsjoki-Kevo today, +31.1C (previous record was +29.2C, Jun 25th, 1990). EDIT the new record is now +31.7C Wow! You white boyz be careful of skin cancer now! |
|
|
|
Post by numerouno on Jun 2, 2013 20:59:16 GMT
numerouno, Does this new high fall under the category of "weather" or "climate change"? Climate change talks to us through weather. This is, after all, a new historical record in the extreme north, and not a passing fluke. The new record goes well together with the statistics: "deviation from the average (1981-2000) for March-May in Helsinki-Kaisaniemi and Sodankylä [in Finnish Lapland]". (fmi.fi)  |
|
|
|
Post by glennkoks on Jun 2, 2013 22:10:36 GMT
"deviation from the average (1981-2000) for March-May in Helsinki-Kaisaniemi and Sodankylä [in Finnish Lapland]". (fmi.fi)
That is a pretty small sampling to be basing much of an average on don't you think?
|
|
|
|
Post by numerouno on Jun 2, 2013 23:11:48 GMT
"deviation from the average (1981-2000) for March-May in Helsinki-Kaisaniemi and Sodankylä [in Finnish Lapland]". (fmi.fi) That is a pretty small sampling to be basing much of an average on don't you think? The average above is the national base level calculated by the FMI, not just those two stations. |
|
|
|
Post by throttleup on Jun 2, 2013 23:22:58 GMT
A new all-time high for June temps is reality in Utsjoki-Kevo today, +31.1C (previous record was +29.2C, Jun 25th, 1990). EDIT the new record is now +31.7C |
|
|
|
Post by numerouno on Jun 2, 2013 23:28:03 GMT
The beginning of blooming of the Bird Cherry in sub-Arctic Circle Finland between 1846-2005. From the Finnish Forest Research Institute. The trend is 8.5 days/100 years. www.metla.fi/uutiskirje/fen/2010-1/uutinen-3.html(Heinäkuu=July and so forth.)  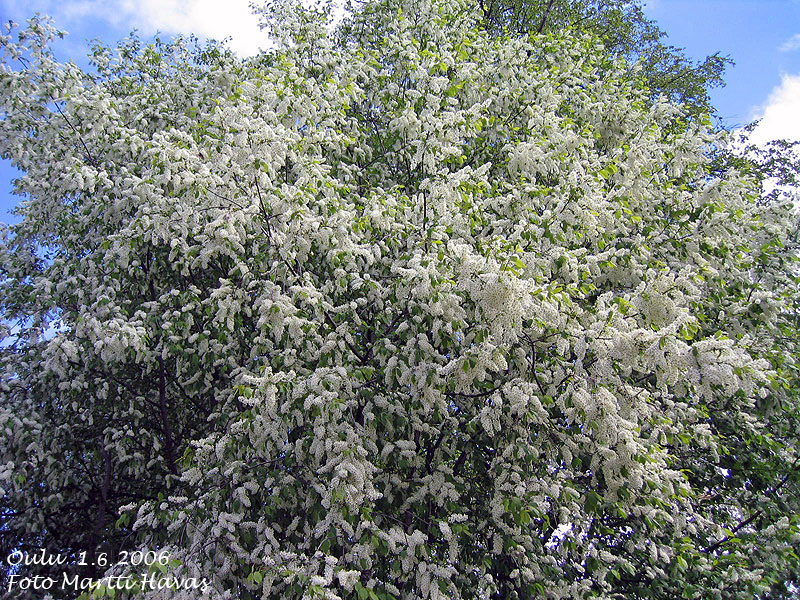 |
|
|
|
Post by sigurdur on Jun 3, 2013 2:32:14 GMT
numerouno:
Does the graph show earlier or later blooming? Do not know if it is July, Aug Sept showing on the graph.
|
|
|
|
Post by cuttydyer on Jun 3, 2013 8:19:35 GMT
England has just experienced its coldest Spring since 1891 - Central England Temperature anomaly for May now in (-0.8°C):  Anomaly to May: -1.01 Provisional CET anomaly (up to 1st June): -1.01  What I would give for some of that fine Finnish weather climate change*... _________________________________________________ *Weather is not climate. All weather events are now climate |
|
|
|
Post by numerouno on Jun 3, 2013 10:52:16 GMT
numerouno: Does the graph show earlier or later blooming? Do not know if it is July, Aug Sept showing on the graph. As I said, Heinäkuu=July. July 1st sits on top. From 1846 (on the left) the blooming date has been creeping down towards an earlier date as time progresses toward the present (to the right). A simple metric that it is accordance with the known climate statistics. In the graph one can actually see clearly the great famine years 1867 and 1868, during which an 8% of the Finnish population died on account of three successive poor harvests. 1866 had a decent beginning, just as in the graph. |
|


