|
|
Post by Ratty on Jul 29, 2015 12:25:51 GMT
|
|
|
|
Post by acidohm on Jul 31, 2015 20:39:17 GMT
1st image was 21/7 2nd image is 30/7 Do dropping West Pacific SSTA have implications for further El Nino development??   |
|
|
|
Post by sigurdur on Jul 31, 2015 21:07:33 GMT
Not only is the surface temp dropping, the 0-700M temp is dropping as well. This area is what fuels the Kelvin waves that fuel the El Nino. This whole El Nino has been one strange one, compared to previous. An outlier....period. |
|
|
|
Post by acidohm on Jul 31, 2015 21:31:50 GMT
I Agree. ...I've never watched an 'el nino' develope before....but I can't justify getting excited about this one really going off...
|
|
|
|
Post by nonentropic on Aug 1, 2015 0:33:14 GMT
on Nullschool the SE trades are still ripping along in the area east of QLD Australia. those winds are cold in relative terms so no great surprise the sea is cooled.
the spin about the El Nino is hard to separate from the real dialogue.
Could this be falling apart right now?
|
|
|
|
Post by sigurdur on Aug 1, 2015 2:06:13 GMT
on Nullschool the SE trades are still ripping along in the area east of QLD Australia. those winds are cold in relative terms so no great surprise the sea is cooled. the spin about the El Nino is hard to separate from the real dialogue. Could this be falling apart right now? The 97-98 El Nino came on fast, got intense, and died really fast. Was followed by a very strong La Nina. This one may end up being the same! |
|
|
|
Post by nonentropic on Aug 1, 2015 3:55:58 GMT
but it cant be ready to die yet or else the heat will be missed and the CA drought and the Australian drought.
|
|
|
|
Post by sigurdur on Aug 2, 2015 3:01:19 GMT
|
|
|
|
Post by acidohm on Aug 2, 2015 7:08:06 GMT
Yeah, thats a really good take on the current situation....when are the new sunspot no's going to start being used as a standard?? Joe is using the old data set to establish a point about stored heat in the system, something that the new no. set does not give us.  |
|
|
|
Post by douglavers on Aug 3, 2015 21:23:20 GMT
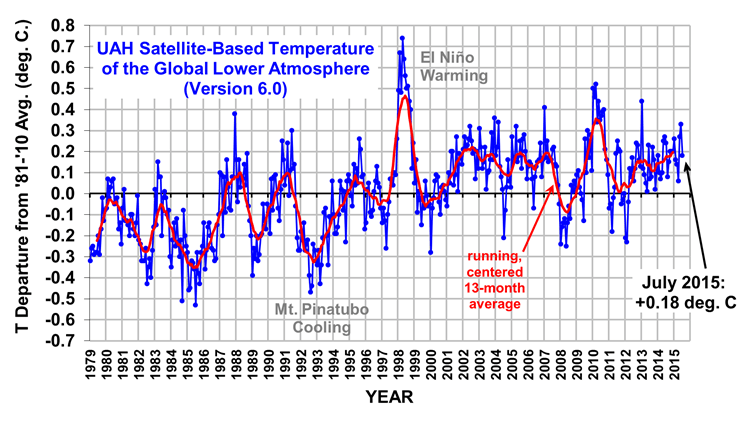 Graph from Dr Roy Spencer's website. I distinctly remember someone saying that El Ninos caused higher global temperatures.
|
|
|
|
Post by tobyglyn on Aug 4, 2015 8:26:44 GMT
Anyone who can't see the accelerating and obviously catastrophic anthropogenic global warming in that graph would have to be blind!!!!  |
|
|
|
Post by Ratty on Aug 4, 2015 11:37:01 GMT
Anyone who can't see the accelerating and obviously catastrophic anthropogenic global warming in that graph would have to be blind!!!! Worse / quicker / more devastating / worrying / needs more funding than we thought.  |
|
|
|
Post by graywolf on Aug 4, 2015 13:13:52 GMT
data.giss.nasa.gov/gistemp/graphs_v3/Fig.A2.gifMy map look different to yours? In fact all of the other temp series maps look different to yours??? Looking like July will come in a top 4 spot for global temp and the 12 month period warmest ever recorded. By the time we get to years end I find it hard to imagine it not smashing last years record high ...... so 'yeah!' Nino's do lead to a warmer planet in the short term? What we would need to see is a 'balancing Nina' straight afterwards but , on the strength of what we saw through the noughties, we just don't seem able to ( last two Nina's were the two 'warmest on record' Nina's???). Maybe all that ocean warming is just about to piss off the deniers by keeping global temps close to this years nino peak as we roll on toward the 2020's........
|
|
|
|
Post by sigurdur on Aug 4, 2015 13:26:28 GMT
Graywolf:
Think of your stats for a minute. The satellite temperature data is from a system that does NOT use infill, nor guesstimates.
|
|
|
|
Post by nautonnier on Aug 4, 2015 15:32:39 GMT
Graywolf: Think of your stats for a minute. The satellite temperature data is from a system that does NOT use infill, nor guesstimates. The amount of infill used in July 2015 has reached the highest levels since records began! |
|


