|
|
Post by missouriboy on Jan 20, 2019 2:53:03 GMT
Codewhacker, you seem to have forgotten my forecast for irregular seasons in 2018 and 2019 with my forecast that true winter would not arrive until closer to February 2019 and that winter will consist of March and April 2019? See ->> solarcycle24com.proboards.com/thread/2770/global-cooling-irregular-seasons-2018I'm really sick and tired of simple-minded comments about the climate and weather when I previously forecasted what the weather would be like long in advance. And yes, global cooling, which includes irregular seasons with irregular weather conditions, extreme temperature variations, the whole ball of wax, which is what the Sun's quiescent phase causes. I think you are correct on that Astromet. Mean temperature change isn't that noticeable. But the weather fluctuations here have been invoking in me lately a feeling of deja vu from way back in the 1950's. Back in the late 1970's all the talk about ENSO was a lot of precipitation associate with El Nino and drought associated with La Nina. Then for the next 30 some years it never seemed to match up to local expectations until about 2012 when California's megadrought was ushered in with the rewarming phase of the 2011/12 La Nina continuing until the 2015 El Nino peaked. Since then we have a lot of precipitation in 2016. Now almost as if on que we are having a wet start to 2019 right in time with a possibly peaking ENSO number. This is how I remember it 6 decades ago. If I can gather up the motivation maybe I will try to match local precipitation records with ENSO and see if the pattern you suggest was apparent 6 decades ago. And if we had or could aggregate the records, we'd likely see the same forces at work in the Mediterranean as well during the 1960s and 70s and earlier cold periods that we've seen operating over these last 3 winters. Note this ghost from the past upon past weather extremes. notalotofpeopleknowthat.wordpress.com/2013/02/09/extreme-weather-in-the-1960s-1970s/Speaking of these changes back then, C C Wallen, chief of the Special Environmental Applications Division, at the World Meteorological Organisation had this to say ... The principal weather change likely to accompany the cooling trend is increased variability-alternating extremes of temperature and precipitation in any given area-which would almost certainly lower average crop yields.
The cause of this increased variability can best be seen by examining upper atmosphere wind patterns that accompany cooler climate. During warm periods a "zonal circulation" predominates, in which the prevailing westerly winds of the temperate zones are swept over long distances by a few powerful high and low pressure centers. The result is a more evenly distributed pattern of weather, varying relatively little from month to month or season to season.
During cooler climatic periods, however, the high-altitude winds are broken up into irregular cells by weaker and more plentiful pressure centers, causing formation of a "meridional circulation" pattern. These small, weak cells may stagnate over vast areas for many months, bringing unseasonably cold weather on one side and unseasonably warm weather on the other. Droughts and floods become more frequent and may alternate season to season, as they did last year in India. Thus, while the hemisphere as a whole is cooler, individual areas may alternately break temperature and precipitation records at both extremes.Sound familiar? Of course, God doesn't give grants to climate scientists and their political handlers.  A shame really. Noah got special treatment. |
|
|
|
Post by missouriboy on Jan 21, 2019 2:50:01 GMT
Does your thermometer work? Yes. Marta insists that I keep a time series which she happily diagnoses. I cannot guarantee how accurate it is. |
|
|
|
Post by AstroMet on Jan 23, 2019 15:19:24 GMT
Codewhacker, you seem to have forgotten my forecast for irregular seasons in 2018 and 2019 with my forecast that true winter would not arrive until closer to February 2019 and that winter will consist of March and April 2019? See ->> solarcycle24com.proboards.com/thread/2770/global-cooling-irregular-seasons-2018I'm really sick and tired of simple-minded comments about the climate and weather when I previously forecasted what the weather would be like long in advance. And yes, global cooling, which includes irregular seasons with irregular weather conditions, extreme temperature variations, the whole ball of wax, which is what the Sun's quiescent phase causes. Dear .... I didn't forget and I've also didn't forget you like insulting people who don't agree with you, inferiority complex? Seattle and the PNW are not getting a Winter this year because there is no global cooling. Code, if you look at your own comments to others, you're the one doing the insulting. Quit with the emotional projections onto others. Now, there is global cooling, and you do not understand how climate transitions work, nor do you read much as I explained this years ago and described (in great detail) how the Sun's gradual decline into quiescent phase affects the Earth's climate. The Earth has had many global cooling climates before in its history so for you to say ignorantly that there is "no global cooling" isn't valid. Also, Seattle and the PNW is getting a winter this year, but it is a LATE WINTER as I already forecast many months ago. So quit with the childish comments. |
|
|
|
Post by AstroMet on Jan 23, 2019 15:49:16 GMT
Codewhacker, you seem to have forgotten my forecast for irregular seasons in 2018 and 2019 with my forecast that true winter would not arrive until closer to February 2019 and that winter will consist of March and April 2019? See ->> solarcycle24com.proboards.com/thread/2770/global-cooling-irregular-seasons-2018I'm really sick and tired of simple-minded comments about the climate and weather when I previously forecasted what the weather would be like long in advance. And yes, global cooling, which includes irregular seasons with irregular weather conditions, extreme temperature variations, the whole ball of wax, which is what the Sun's quiescent phase causes. I think you are correct on that Astromet. Mean temperature change isn't that noticeable. But the weather fluctuations here have been invoking in me lately a feeling of deja vu from way back in the 1950's. Back in the late 1970's all the talk about ENSO was a lot of precipitation associate with El Nino and drought associated with La Nina. Then for the next 30 some years it never seemed to match up to local expectations until about 2012 when California's megadrought was ushered in with the rewarming phase of the 2011/12 La Nina continuing until the 2015 El Nino peaked. Since then we have a lot of precipitation in 2016. Now almost as if on que we are having a wet start to 2019 right in time with a possibly peaking ENSO number. This is how I remember it 6 decades ago. If I can gather up the motivation maybe I will try to match local precipitation records with ENSO and see if the pattern you suggest was apparent 6 decades ago. The fact is Icefisher that the world is already in the first phase of global cooling, which I calculated would begin in mid-December 2017. We are also about to see the first true El Nino in 2020 since 2009-2010 that will be followed by a powerful La Nina in 2021. These fluctuations are caused by the Sun's activity, which is toward a Grand Minimum, as I forecasted. This new mini-ice age will eventually become known as the Eddy Minimum. |
|
|
|
Post by walnut on Jan 23, 2019 18:28:55 GMT
The jet stream seems to spend most of it's time north of my location. That is a change from years before, and it has meant mild winters in Oklahoma.
I think that cynicism seems more warranted against the predictions made by people who want in our pocket books, the ones who demand that we shut down power plants, send tax money to Bangladesh, etc. At least so far, I still haven't received a bill from Astromet for his predictions.
|
|
|
|
Post by walnut on Jan 23, 2019 18:51:23 GMT
Rapid and frequent climate change in the PNW is nothing new. But witch doctors appropriating and leveraging a natural cycle for their own gain probably is something new.
|
|
|
|
Post by AstroMet on Jan 24, 2019 1:15:18 GMT
Code, if you look at your own comments to others, you're the one doing the insulting. Quit with the emotional projections onto others. Now, there is global cooling, and you do not understand how climate transitions work, nor do you read much as I explained this years ago and described (in great detail) how the Sun's gradual decline into quiescent phase affects the Earth's climate. The Earth has had many global cooling climates before in its history so for you to say ignorantly that there is "no global cooling" isn't valid. Also, Seattle and the PNW is getting a winter this year, but it is a LATE WINTER as I already forecast many months ago. So quit with the childish comments. Astro, Let's get on the same page metaphorical, can you please..give an instance of something I've posted you were insulted by? And for the record ending your comment to me by calling my remarks childish doesn't help move the conversation forward. So put up with a what and when did I insult you? Lastly, yep you've been posting about a quiescent phase but the well know solar scientist who used to post on this board, Dr. S, for one, doesn't agree with you. That's fine with me, as there will not be a long time before everyone will know for certain that we are in a climate of global cooling. The weather of that climate regime is already underway (for those with eyes open to see it) but it will become very obvious in a few short years with the Sun's Grand Minimum. You see, a mini ice-age makes itself felt faster than most want to believe. See for yourself, as the weather of global cooling is coming to a neighborhood near you. |
|
|
|
Post by Ratty on Jan 25, 2019 0:58:40 GMT
Sounds like it was written from the standard AGW playbook: If you can't find facts, make something up. |
|
|
|
Post by AstroMet on Feb 5, 2019 1:25:59 GMT
Codewhacker, you seem to have forgotten my forecast for irregular seasons in 2018 and 2019 with my forecast that true winter would not arrive until closer to February 2019 and that winter will consist of March and April 2019? See ->> solarcycle24com.proboards.com/thread/2770/global-cooling-irregular-seasons-2018I'm really sick and tired of simple-minded comments about the climate and weather when I previously forecasted what the weather would be like long in advance. And yes, global cooling, which includes irregular seasons with irregular weather conditions, extreme temperature variations, the whole ball of wax, which is what the Sun's quiescent phase causes. Dear .... I didn't forget and I've also didn't forget you like insulting people who don't agree with you, inferiority complex? Seattle and the PNW are not getting a Winter this year because there is no global cooling. That's funny Code because the last time I checked inferiority complexes do not forecast. And I don't need you to agree with me on anything since you obviously do not know what you're talking about. Saying that Seattle and the Pacific Northwest is not getting a winter simply because I forecasted that winter is going to be late this year (and I'm correct) does not mean that you are right, because you are not and that's because you do not know what you are talking about. The Pacific Northwest is not getting a winter this year, you say? Well, right now a sweep of cold air is bringing snow to the PNW as temperatures plummet across the region. www.washingtonpost.com/national/rare-snow-falls-on-seattle-as-midwest-thaws-from-cold-blast/2019/02/04/be69a5fa-28e2-11e9-906e-9d55b6451eb4_story.htmlHere is Feb. 4-5, 2019 for Seattle:www.accuweather.com/en/weather-news/snow-to-whiten-western-us-as-cold-air-takes-hold-into-tuesday/70007330Seattle slips and slides through unusually heavy snowfallwww.cnn.com/2019/02/04/us/seattle-snow-wxc/index.htmlSo tell me Code: what does your 'forecast' stating that there will be no winter this year in Seattle and the PNW really mean? |
|
|
|
Post by fatjohn1408 on Feb 6, 2019 15:10:41 GMT
Taking this graphic from Astro's thread starter.  Now take the description from the paper that the Sun is a ball of plasma with each atom/ion in its own orbit around the barycenter and also spinning with the Sun's rotation. What is the effect of the path of the barycenter through the ball of plasma with some plasma retrograde and some prograde with the rotation of the Sun. I would expect it to cause some 'swirling' and upset any stability leading perhaps to more sun spots. However, we are now in a period where the barycenter is going outside the sun (it can go 2 solar diameters out) so should the swirling would calm down and the sun become quieter? If so then as seen in the diagram there are about 8 years now before the barycenter briefly penetrates the Sun then goes back out to a diameter or so away. Is this the mechanism that gives us active and quiet period of the Sun? Very interesting post, would second these questions for an answer from Astromet. Additionally I would like to ask if you have thoughts on the total irradiance of the sun and how much this will decline? It seems as if the current minimum isn't going to be particularly lower than the previous one. lasp.colorado.edu/data/sorce/total_solar_irradiance_plots/tim_level3_tsi_24hour_2400x1800.pngAm I correct that this is where we should see the coming cooling being established first? Also will we see significantly higher arctic sea ice extent in the coming months compared to previous years? It is notable that we now have four years of increasing sea ice in the arctic, coinciding with solar activity decline. Nonetheless it seems to me that the trend is very small. Your thoughts on this? nsidc.org/arcticseaicenews/charctic-interactive-sea-ice-graph/ |
|
|
|
Post by missouriboy on Feb 6, 2019 20:10:46 GMT
Welcome aboard Mr fatjohn.
|
|
|
|
Post by nautonnier on Feb 6, 2019 21:07:56 GMT
Taking this graphic from Astro's thread starter. {{SNIP IMAGE}} Now take the description from the paper that the Sun is a ball of plasma with each atom/ion in its own orbit around the barycenter and also spinning with the Sun's rotation. What is the effect of the path of the barycenter through the ball of plasma with some plasma retrograde and some prograde with the rotation of the Sun. I would expect it to cause some 'swirling' and upset any stability leading perhaps to more sun spots. However, we are now in a period where the barycenter is going outside the sun (it can go 2 solar diameters out) so should the swirling would calm down and the sun become quieter? If so then as seen in the diagram there are about 8 years now before the barycenter briefly penetrates the Sun then goes back out to a diameter or so away. Is this the mechanism that gives us active and quiet period of the Sun? Very interesting post, would second these questions for an answer from Astromet. Additionally I would like to ask if you have thoughts on the total irradiance of the sun and how much this will decline? It seems as if the current minimum isn't going to be particularly lower than the previous one. lasp.colorado.edu/data/sorce/total_solar_irradiance_plots/tim_level3_tsi_24hour_2400x1800.pngAm I correct that this is where we should see the coming cooling being established first? Also will we see significantly higher arctic sea ice extent in the coming months compared to previous years? It is notable that we now have four years of increasing sea ice in the arctic, coinciding with solar activity decline. Nonetheless it seems to me that the trend is very small. Your thoughts on this? nsidc.org/arcticseaicenews/charctic-interactive-sea-ice-graph/TSI: As we are repeatedly told by Leif the TSI variance is extremely small and even the large variance in E-UV is small in energy terms. However, the effect on the atmospheric chemistry such as the formation of ozone which affects the temperature in the outer layers of the atmosphere can be considerable - to the extent that the atmosphere has shrunk so much that satellites are not getting the expected level of drag and are staying in low earth orbit longer. This shrinkage and changes in temperature plus the Svensmark effects as the solar wind reduces and galactic cosmic rays enter the atmosphere at a higher rate potentially seeding more cloud, will all have multiple effects that may exceed the affect expected from a 1 or 2% drop in TSI. There are also magnetic structures that link Earth to the Sun and other planets: science.nasa.gov/science-news/science-at-nasa/2008/30oct_ftes www.frontiersin.org/research-topics/8284/magnetic-flux-ropes-from-the-sun-to-the-earth-and-beyondwww.sciencedaily.com/releases/2011/06/110615103218.htmwww.physics-astronomy.com/2017/03/magnetic-rope-observed-for-first-time.html#.XFtHZc17n0MThese appear to be driven by the planet alignments and the solar wind runs along them and therefore huge electric currents are set up. I would think that the orbital positions and the conjunctions will influence the strength and positions of these. We are told that sunspots are magnetic disturbances in the sun is it possible that in certain configurations of the planets with their 'magnetic ropes' more magnetic disturbances are caused then in other configurations? If the sun is so highly magnetized is the so called 'Solar Dynamo' in reality a magnetic solar tide being pulled by the planets? If so when the Sun wanders so far from the barycenter that means that the bulk of the planets must be aligned on the other side so the rope configuration may be less tortuous so less Sun spots? (Pause to wave arms  ) So there is a lot more than just TSI to consider. Arctic Sea Ice is affected by the Atlantic Multidecadal Oscillation (AMO) and seems to run in synch with it. It has been in a warm phase and may be dropping into a cold phase. It is possible that the AMO is affected by Length of Day which is itself driven by the barycenter effects on the orbit of Earth _and_ the depth of the atmosphere _and_ the thermohaline current (if it exists ) I am sure there are other influences on Arctic and Antarctic ice. These are all oscillations and all have varying periods that is they may oscillate but more in the way a system state orbits a 'strange' attractor in a Poincare section. So imagine:   These are two oscillators that are themselves chaotic - say the AMO and PDO (or whatever - there may be unknowns) now imagine the joint effect of both those attractors they seem to be running in a simple oscillation but with a poincare section you can see the variance and the co-variance of the two attractors affects the magnitude of any affect on the climate. (there may be n attractors). Looking at the changes in the Sun and expecting as many seem to - a simple correlation with the climate - is unlikely. There may be times - perhaps most times that the joint effect of the orbits of the attractors has little effect canceling each other out, and, rarely, others where the effects are both at peak in the same sense could be extreme. So doing a Fourier analysis of various 'measures' on Earth is only likely to show 'noise'. I think that the approach of Astromet is to look at the positions of the planets and other various effects, look for analogues in the past and from those assess the likely effects which may be cumulative, on the climate. [Yes there is probably more]. That is all off the top of the head conjecture - but things are a LOT more complicated than more CO2 -> hot; or even small TSI drop -> Cold. Please everyone leap in ;-) I would like to run one of the barycenter models against the rotation of the Sun and number of sunspots. It might be instructive. |
|
|
|
Post by nautonnier on Feb 6, 2019 22:56:37 GMT
"NASA Sees Climate Cooling Trend Thanks to Low Sun Activity
The climate alarmists just can’t catch a break. NASA is reporting that the sun is entering one of the deepest Solar Minima of the Space Age; and Earth’s atmosphere is responding in kind.
So, start pumping out that CO2, everyone. We’re going to need all the greenhouse gases we can get.
“We see a cooling trend,” said Martin Mlynczak of NASA’s Langley Research Center. “High above Earth’s surface, near the edge of space, our atmosphere is losing heat energy. If current trends continue, it could soon set a Space Age record for cold.”
The new data is coming from NASA’s Sounding of the Atmosphere using Broadband Emission Radiometry or SABER instrument, which is onboard the space agency’s Thermosphere Ionosphere Mesosphere Energetics and Dynamics (TIMED) satellite. SABER monitors infrared radiation from carbon dioxide (CO2) and nitric oxide (NO), two substances that play a vital role in the energy output of our thermosphere, the very top level of our atmosphere."More here: www.thenewamerican.com/tech/environment/item/30214-nasa-sees-climate-cooling-trend-thanks-to-low-sun-activity
|
|
|
|
Post by missouriboy on Feb 7, 2019 21:20:20 GMT
Theodore, thank you for bringing this to my attention. This is a great learning opportunity. How cold do you think it will get? Maybe take the top 25 major cities worldwide and give us an example of summer/winter temps we may experience going into this minimum 2017-20, then 2029-2031, 2045-2050. Maybe I need to move to Florida or southern Texas . You're welcome. As for how cold it will get, from my calculations, it looks like we have a 2.8 degree Celsius decline by the year by 2029-2030. It is going to get colder and colder during the 2020s and by the mid-2030s, we will already be within the mini-ice age. As global cooling begins in December 2017, we will have, according to my climate forecast, the next ENSO between 2019-2022, a moderate El Nino followed by a strong La Nina - the first in modern times under the new climate regime of global cooling. I lose track so I'm stacking some of Astro's forecasts here as I review this thread. Some place I can go back to when I have a brain "burp". Next ENSO Event - 2019-2022 Forecast Moderate El Nino - mid 2019 into 2020 Forecast Strong La Nina - 2021 - 2022 Temperature decline (global I assume) of 2.8 C - 2016 to 2029-30 (essentially the next solar cycle - SC25). If I missed anything there Astro, please correct me. Well, I went in and grabbed a few past graphs to try and evaluate what a 2.8 C temperature shift could look like AND how fast such events might happen given past data, IF we even have a comparable. World Long Historical First, I have no global temperature time series to compare. Most seem to be based on Ice core and tree ring analysis, and the range from top to bottom is nowhere near 2.8 C. Graph 5 for the American Grain Belt cross section shows a range of about 6 C, but that is regional, not global. Graph 6 compares the long winter records for Philadelphia to the CET and Philly has a max range of about 5 C. Again local/regional, not global. A drop of 2.8 C for graph 5 would bring temps back to the late 1800s. The same for graph 6 would return temps to Dalton Minimum winter levels. Base Temperature Transition Time Many historical graphs show that temperatures and indexes can change dramatically within a decade or so. ENSO aggregate values in graphs 3 & 4 show a sharp drop from 1947-57 and an even sharper rise (the Great Climate Shift) from 1976 to 1986. The Philadelphia winter times series also shows these same shifts of about 2 to 2.5 C. The American Grain Belt series show that annual temperature variance has increased dramatically since about 2005, with year to year swings in temperature spanning 4 C. I know that Joe believes that ocean heat may take a long time to "bleed off", but maybe they said the same thing back in the late 1940s. I'm not sure we really have a bankable clue as to how fast the ocean is transferring heat to the atmosphere (And it's still a travesty Kevin!). One decade from 2015 (which was when this forecast was made) brings us to 2025, 3 years after the strong forecasted La Nina, and deep into the heart of SC25. If, by then, we are still asking each other if it's over, then ....  Best bet may still be to keep your coats ... and buy quantities of good quality thermal undies. Sig. Can we start a good quality wool exchange? 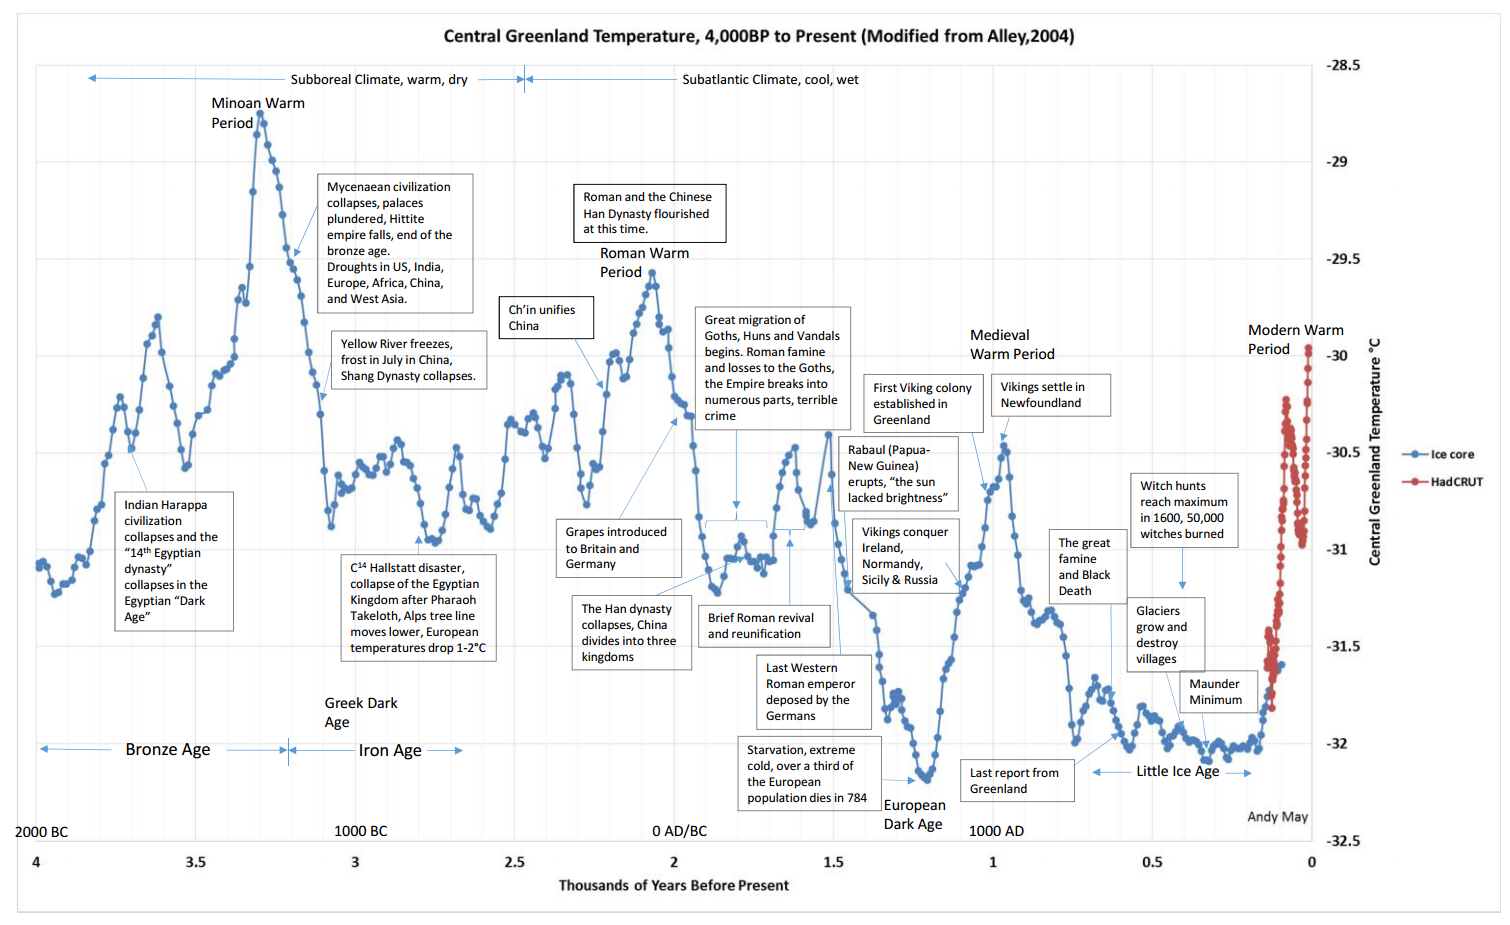  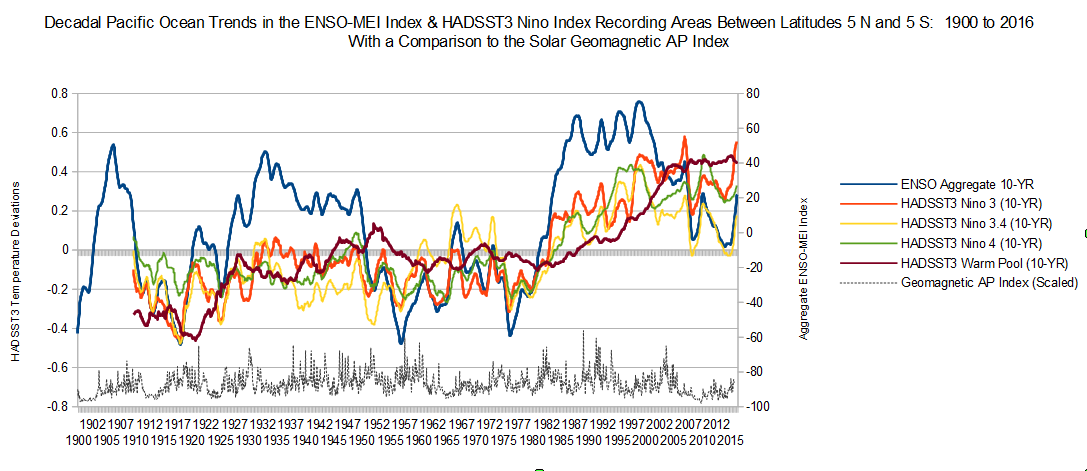 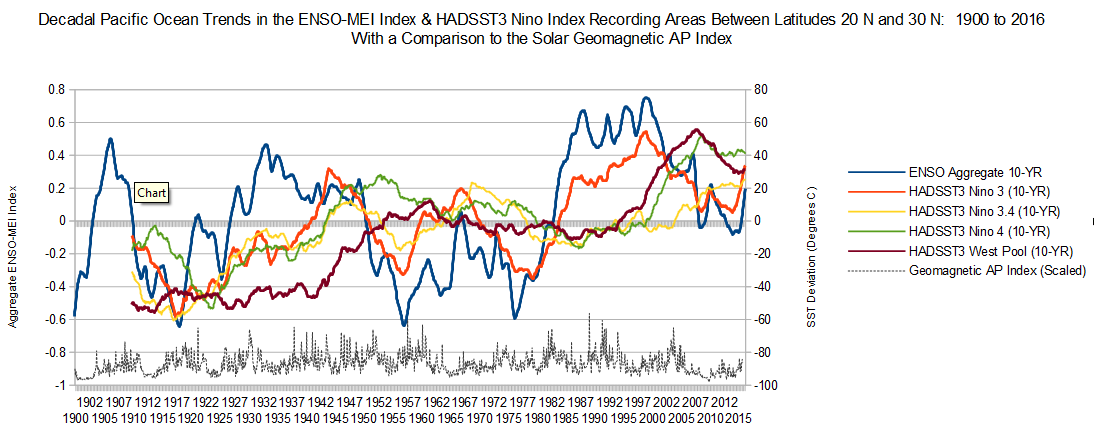 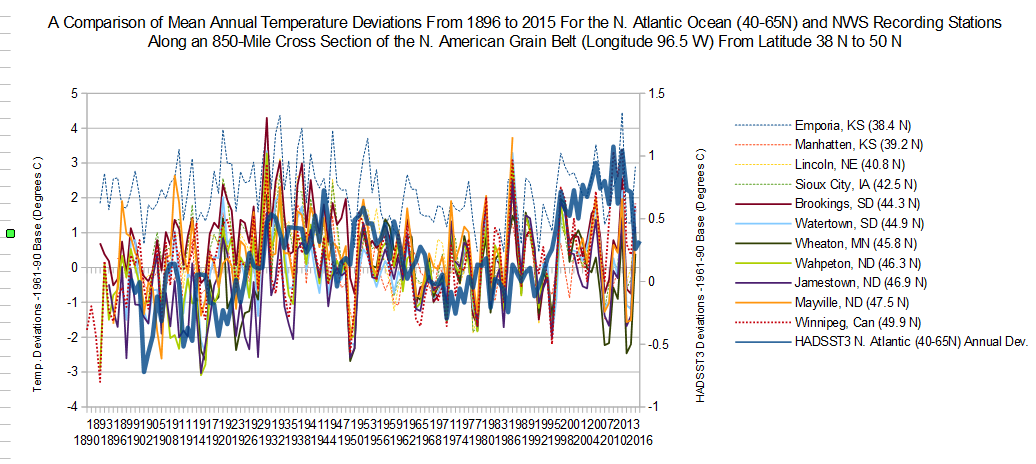 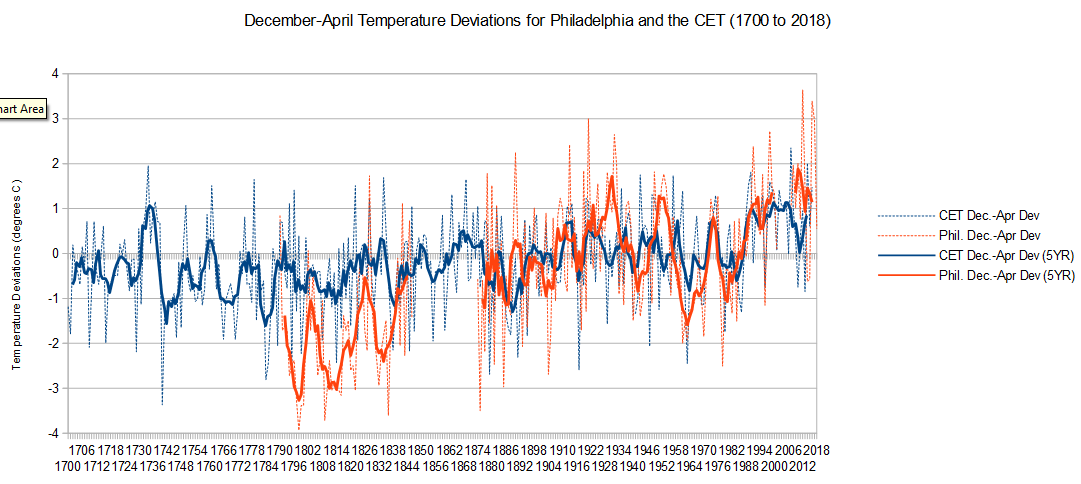 |
|
|
|
Post by Ratty on Feb 8, 2019 3:26:37 GMT
You're welcome. As for how cold it will get, from my calculations, it looks like we have a 2.8 degree Celsius decline by the year by 2029-2030. It is going to get colder and colder during the 2020s and by the mid-2030s, we will already be within the mini-ice age. As global cooling begins in December 2017, we will have, according to my climate forecast, the next ENSO between 2019-2022, a moderate El Nino followed by a strong La Nina - the first in modern times under the new climate regime of global cooling. I lose track so I'm stacking some of Astro's forecasts here as I review this thread. Some place I can go back to when I have a brain "burp". Next ENSO Event - 2019-2022 Forecast Moderate El Nino - mid 2019 into 2020 Forecast Strong La Nina - 2021 - 2022 Temperature decline (global I assume) of 2.8 C - 2016 to 2029-30 (essentially the next solar cycle - SC25). If I missed anything there Astro, please correct me. Well, I went in and grabbed a few past graphs to try and evaluate what a 2.8 C temperature shift could look like AND how fast such events might happen given past data, IF we even have a comparable. World Long Historical First, I have no global temperature time series to compare. Most seem to be based on Ice core and tree ring analysis, and the range from top to bottom is nowhere near 2.8 C. Graph 5 for the American Grain Belt cross section shows a range of about 6 C, but that is regional, not global. Graph 6 compares the long winter records for Philadelphia to the CET and Philly has a max range of about 5 C. Again local/regional, not global. A drop of 2.8 C for graph 5 would bring temps back to the late 1800s. The same for graph 6 would return temps to Dalton Minimum winter levels. Base Temperature Transition Time Many historical graphs show that temperatures and indexes can change dramatically within a decade or so. ENSO aggregate values in graphs 3 & 4 show a sharp drop from 1947-57 and an even sharper rise (the Great Climate Shift) from 1976 to 1986. The Philadelphia winter times series also shows these same shifts of about 2 to 2.5 C. The American Grain Belt series show that annual temperature variance has increased dramatically since about 2005, with year to year swings in temperature spanning 4 C. I know that Joe believes that ocean heat may take a long time to "bleed off", but maybe they said the same thing back in the late 1940s. I'm not sure we really have a bankable clue as to how fast the ocean is transferring heat to the atmosphere (And it's still a travesty Kevin!). One decade from 2015 (which was when this forecast was made) brings us to 2025, 3 years after the strong forecasted La Nina, and deep into the heart of SC25. If, by then, we are still asking each other if it's over, then .... Best bet may still be to keep your coats ... and buy quantities of good quality thermal undies. Sig. Can we start a good quality wool exchange? Maybe this post should be the first on a new thread, 'Watching & Waiting' ........... ?? I'm serious. |
|


 A shame really. Noah got special treatment.


 )
)  Best bet may still be to keep your coats ... and buy quantities of good quality thermal undies. Sig. Can we start a good quality wool exchange?