|
|
Post by missouriboy on Mar 7, 2017 14:43:51 GMT
Report notes that this area of French Alps received another meter of snow in the last 72 hours. Seems like a continuation of a very bad European winter. Quantification? Qualification? Is this where the N American winter went? www.cnn.com/2017/03/07/europe/france-avalanche-tignes/ |
|
|
|
Post by missouriboy on Mar 7, 2017 15:39:04 GMT
Naut, we're a hot dry place with (very) variable weather. I've seen a lot of it ...... age has it's benefits but I wasn't thinking that when I was mowing the lawn this afternoon late.  I find this chart makes some folk reflect on recent claims of unprecedented weather: Australia's Variable Rainfall PosterSolar maximum dry? Solar minimum wet? Get ready for more wet? |
|
|
|
Post by missouriboy on Mar 7, 2017 17:18:03 GMT
It won't stop snowing in the Cascade Mountains of Washington State which means the dams will be full and electricity rates "should" be low, irrigation canals will be full, salmon will be happy, invasive insect species are suffering die back from cold and I get to ski. Heaven comes in many forms.  Does 2016-17 look something like the 1960s-70s in your area code? The 1890s-1900s? |
|
|
|
Post by missouriboy on Mar 7, 2017 18:14:30 GMT
Joe Bastardi's daily weather summery for Friday (March 3) www.weatherbell.com/ has an interesting assessment of the Australian weather situation and that of the globe as well. Seems like drought and flood on the smallest continent across 40 degrees of longitude should focus peoples' attention on forces that generate such variance across relatively small areas. Note the below normal temperatures (a ring of cold if you will) running south-southwest across Europe and Africa from a Siberian focal point at about 60 E longitude, and a second directly opposite at about 120 W Longitude extending south-southeast from Western Canada through S America. Has anyone noticed a similar global split (~180 degrees apart) in past winters? Europe has had the worst of it this year. Does this pattern stay for next winter? Or does it rotate? And for what reasons? Boy, I really hate this settled science. Missouri update. Peach tree buds are swelling and daffodils are blooming. Me fears a March cold snap could destroy any potential crop. 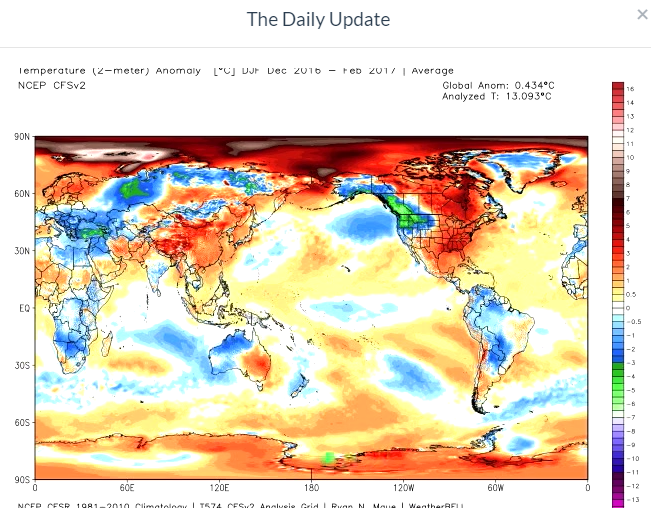 Now it's settled. We just had the warmest February in the 128-year (since 1890) recorded record ... and current forecasts show no cold outbreaks into the third week in March. Will March go out like a lion? Extraordinary North-to-south cold outbreaks matched by extraordinary south-to-north flows of warm air going toward the Arctic across central-eastern N America ... and China? Carrying loopiness to a new(?) extreme? Do we have any analogs for this? |
|
|
|
Post by sigurdur on Mar 7, 2017 18:17:58 GMT
Yes. It is cold in ND. Sub zero temps. We would share Missouri boy but don't think you would enjoy them.
|
|
|
|
Post by missouriboy on Mar 7, 2017 20:17:26 GMT
Yes. It is cold in ND. Sub zero temps. We would share Missouri boy but don't think you would enjoy them. I know my peaches wouldn't. They seem convinced that spring is here. But they have been fooled before. |
|
|
|
Post by sigurdur on Mar 7, 2017 20:56:11 GMT
Yes. It is cold in ND. Sub zero temps. We would share Missouri boy but don't think you would enjoy them. I know my peaches wouldn't. They seem convinced that spring is here. But they have been fooled before. Do they have a fuzzy recollection? |
|
|
|
Post by Ratty on Mar 7, 2017 22:34:50 GMT
I know my peaches wouldn't. They seem convinced that spring is here. But they have been fooled before. Do they have a fuzzy recollection? Peaches DO have an inbuilt logic. Seriously ...... we're starting to get a few sub-20C mornings. |
|
|
|
Post by missouriboy on Mar 7, 2017 23:04:28 GMT
I know my peaches wouldn't. They seem convinced that spring is here. But they have been fooled before. Do they have a fuzzy recollection? They may have to 'fuzz up'. Weather forecast just changed to snow on Saturday and one night below freezing (21F). We'll see what's left afterwards. |
|
|
|
Post by missouriboy on Mar 7, 2017 23:06:12 GMT
Do they have a fuzzy recollection? Peaches DO have an inbuilt logic. Seriously ...... we're starting to get a few sub-20C mornings. That's purfect weather there Ratty. |
|
|
|
Post by missouriboy on Mar 8, 2017 4:13:24 GMT
|
|
|
|
Post by Ratty on Mar 8, 2017 6:58:40 GMT
We've had a hot Summer, no doubt. In places, not everywhere and it's staying hot with an intense low pressure system virtually stationary in the Tasman Sea. Australia is a hot, dry place. Captain Cook's ** diaries confirm that in the year 1770. Moree is a hot town on a flat dry plain. Summer TMax mean over the years is >33C. Will Steffan is an arch-alarmist. Australia's climate records are in an appalling state, making it impossible to believe "record" anything. Adelaide's hottest Christmas Day in seventy years .... really? I thought it was cooler back then. Perth's rainfall? Isn't that a GOOD THING? ** James not John |
|
|
|
Post by sigurdur on Mar 8, 2017 21:17:21 GMT
|
|
|
|
Post by missouriboy on Mar 9, 2017 18:32:16 GMT
This strikes me as a classic case of the misuse of statistics. Their approach starts out well enough, but falls apart when they attempt to move from a 'measured' world to the future. I'll ignore for the moment the possibility they might have an 'agenda'.  The classical application of statistics takes a known or measured world and quantifies a range of probabilities for reproducing specific results (or answers to specific questions). A standard deck of cards has 52 possible results when drawing one card assuming the deck is randomly mixed. Thus, one has a 1.92% chance of drawing the ace of spades (or any other card) if you draw a single card a large number of times. The important point here is that the deck (values of the cards) never changes. There is no 'magic' new suit of moons that may suddenly appear in the deck. Thus, the future is always like the past. There is also no measurement error. The ace of spades is always the ace of spades and the 52 observations are always the same. There are no known or unknown forces restructuring the deck in different time periods. OK, so they have 119 Februarys in their world from 1898 to 2017. Their chance of drawing Feb. 2017 in any draw from a randomly assembled deck of one February per year is 0.84%. They properly understand that they are not dealing with a static deck ... that they are dealing with a deck whose values will change in the future. Further, they assume there are definable trends in their deck, which will change the values of their deck in the future. They fail to account for the fact that their measured deck 1) accounts for only a very small sub-sample of all Februarys, and 2) the values of their existing Februarys may have been 'fudged' due to changes in instrumentation, locational environment, or, dare we say it, 'fraud'. Finally, their use of linear trends fails to account for any embedded cycles in their data. One could argue that appending measured cyclical trends to their forecasts would produce essentially the same results, but this fails to address the issues stated in numbers 1 and 2 above. Of course, their positive trends are opposite of longer-term trends that are not included in their measurement world. Their forecasts assume a continuation of trends produced by climate models that have a 'poor' (generous) record of forecasting what has actually happened ... a little like the financial 'boomers' who have consistently managed to fly that linear puppy right off the cliff of poor assumptions. To illustrate some of the above issues, I quickly grabbed some existing graphs including the temperature deviation time series for Columbia, MO and Grand Forks, ND (graphs 1 and 2 below), four graphs showing longer time trends for the CET and Phiadelphia from the 1700s, and one set of graphs showing multiple long-term time series. It is clear that the authors' 119-year time series is not representative of longer-term series. It is almost exclusively extracted from a 100-year period dominated by the 'grand solar maximum' (1900 to 2000). Their trend has a positive slope reinforced by what have been documented as 'selective downward adjustments' of temperature records in the 1920s-1950s. Graphs 1 and 2 probably show the results of such adjustments between Columbia, MO and Grand Forks, ND. Why Columbia escaped(?) is another story. Summer and winter temperatures show different trends. While winters have shown positive trends since at least the Maunder Minimum (CET record), summer temperatures were nearly as high in the 1770s and 1820s (CET) as they are today. The summer trend for Columbia, MO is negative since about 1935, where as the 'adjusted' summer trend for Grand Forks is positive. Longer term trends in Svalgard's chart show a negative trend prior to 1900. 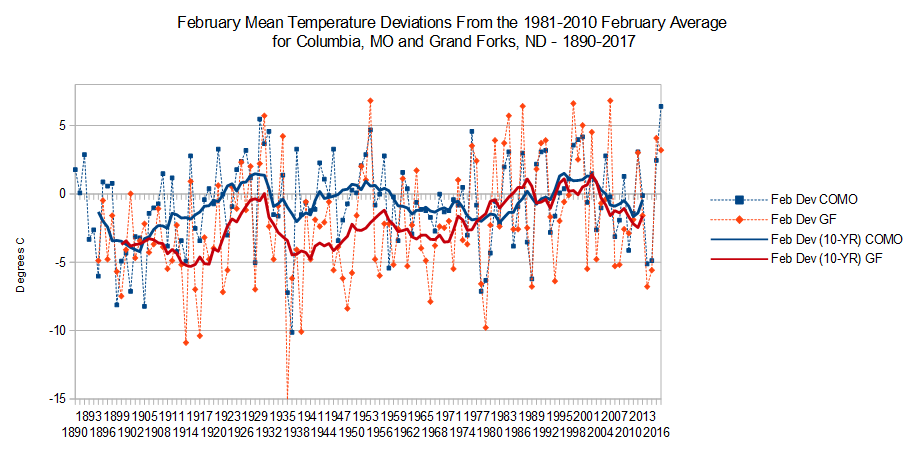 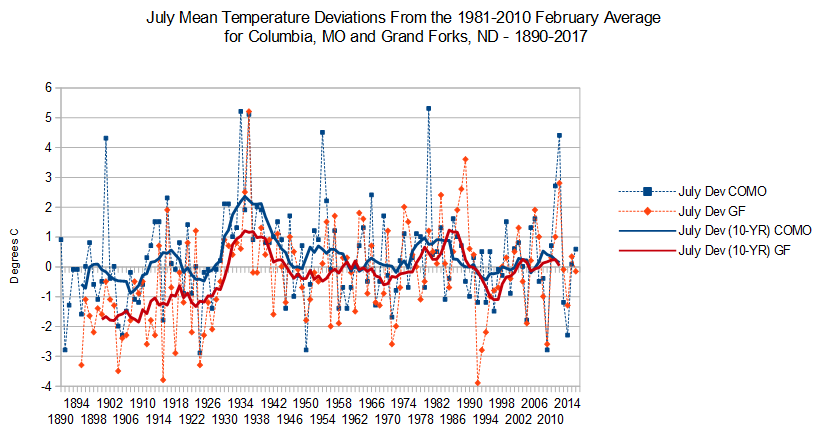 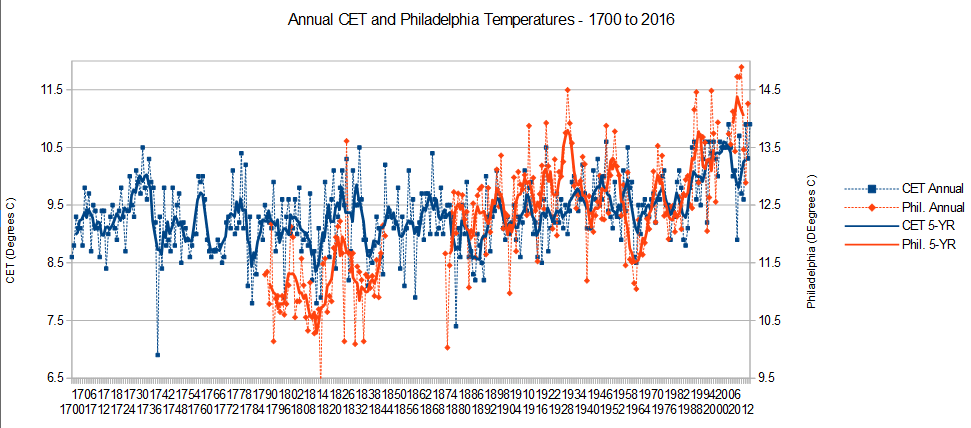 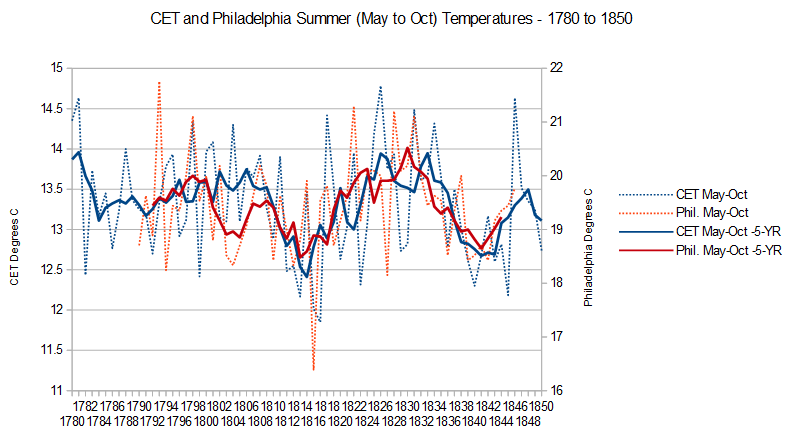 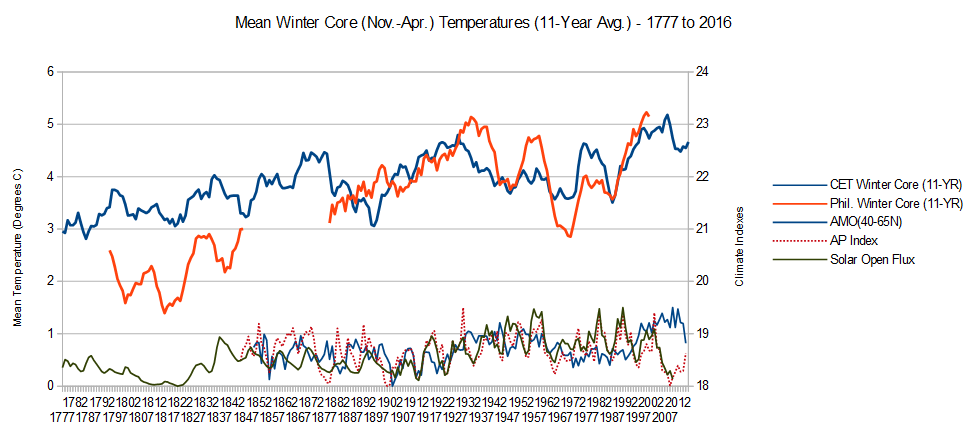 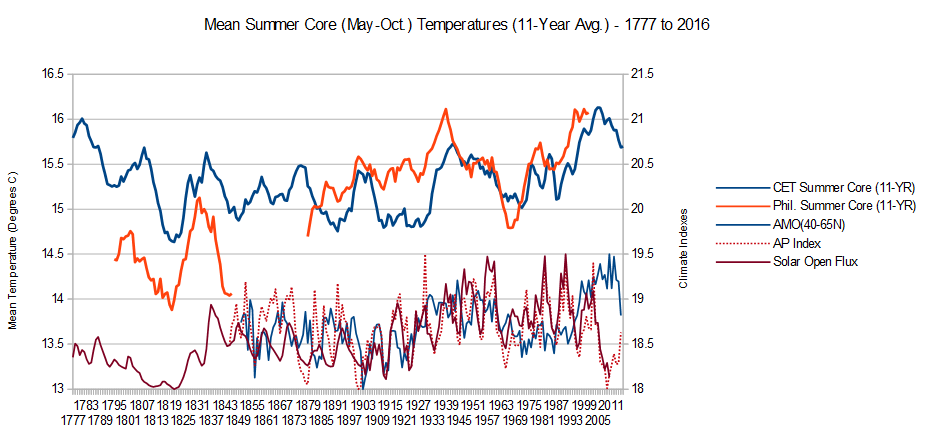 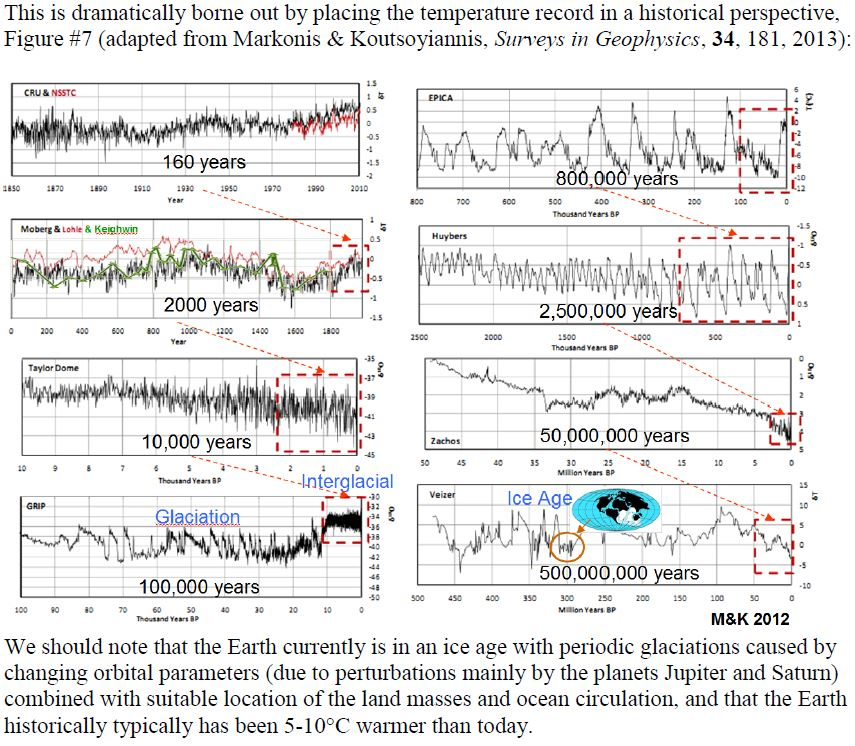
|
|
|
|
Post by Ratty on Mar 10, 2017 23:45:09 GMT
Weird maps:  |
|


 Does 2016-17 look something like the 1960s-70s in your area code? The 1890s-1900s?
