|
|
Post by acidohm on May 31, 2017 21:12:56 GMT
Sun fans probably just have to blame their bad luck is was a La Nina winter on that one.
Not sure it's as cut and dry as that??!
|
|
|
|
Post by missouriboy on May 31, 2017 21:54:06 GMT
Latest noaa update shows a reduction in subsurface warm anomalies..El nino potential is fading Those were the warm anomalies that were going to kill the 'cold blob'? The 'cold blob' is the normal. The 'warm blob' is the anomaly. And if you look at graph number 2 and construct a 10-year running sum of PDO values (instead of equally weighted months), then the 'warm blobs' had their peak in the 1940s and have been declining since. Notice how quickly the warm became cold from 1945 to 1950. By this change, we mean the East Pacific, which is what the PDO is all about. 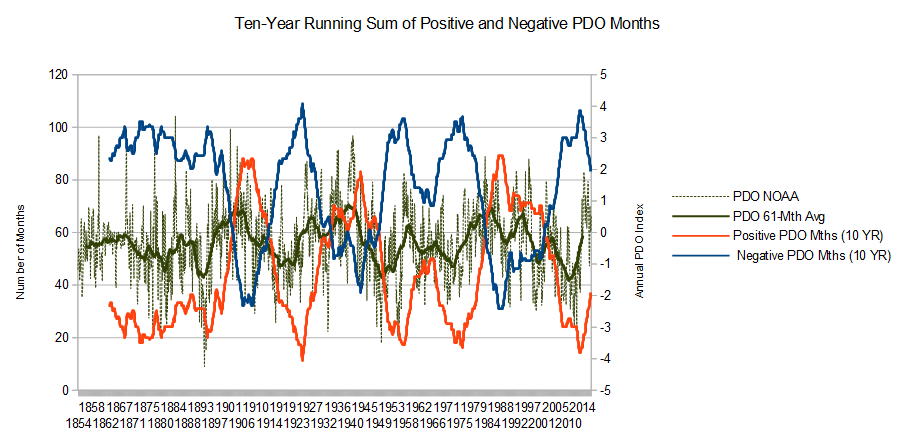 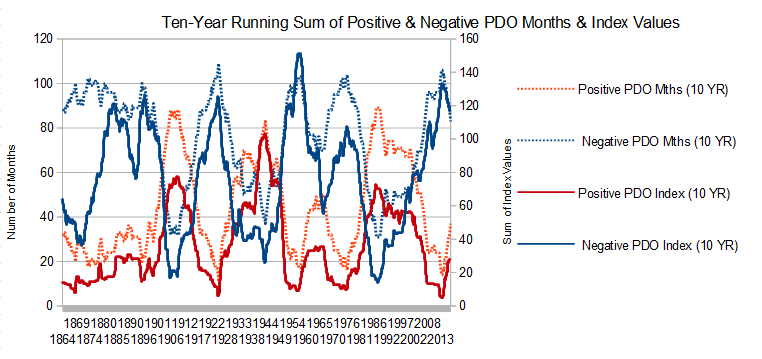 |
|
|
|
Post by AstroMet on Jun 1, 2017 23:21:50 GMT
This current map has a different view - just as cold but more interestingly shows cold off Peru that seems to indicate that an El Nino may not happen this year not even a Modoki.  I forecasted the last El Nino, and also forecasted the next as starting 2019-2020. It will be a pretty moderate to strong El Nino, that will make 2020 a washout solar year. It will be followed by a powerful La Nina that will dominate 2021-2022. Until that time, we will see a variety of cold and warm blobs, with the cold water anomalies predominate until 2019 when the next El Nino will rear its head. |
|
|
|
Post by duwayne on Jun 2, 2017 14:45:40 GMT
This current map has a different view - just as cold but more interestingly shows cold off Peru that seems to indicate that an El Nino may not happen this year not even a Modoki. I forecasted the last El Nino, and also forecasted the next as starting 2019-2020. It will be a pretty moderate to strong El Nino, that will make 2020 a washout solar year. It will be followed by a powerful La Nina that will dominate 2021-2022. Until that time, we will see a variety of cold and warm blobs, with the cold water anomalies predominate until 2019 when the next El Nino will rear its head. Astromet, am I correct in concluding that you predict that ENSO will be on the cold side of neutral for much of the next year and a half, but a full blown La Nina isn't likely in that time frame? |
|
|
|
Post by duwayne on Jun 13, 2017 15:02:38 GMT
My lead-in to ENSO posts has usually been that "I don't pretend to be able to predict ENSO". I'm going to be a little braver on this post. If the current ENSO path labelled as 2015 on the chart below follows the paths of the 2 previous ENSOs which started with strong El Ninos, we may well see La Nina readings of less than -0.5 in the weekly ONIs later this year.
There is another reason that makes me think a cooling in the Nino3.4 region may be in the offing but I'm going to hold off on discussing that for now.
The numbers on the bottom are the weeks from the first week in January of the year (color) shown. The numbers on the left are the weekly ONIs or ENSO readings. It's been 127 weeks since the 2015 Super El Nino began it's upward swing. After about 127 weeks the 1997 and 2009 ENSOs headed down into the La Nina range.
Note: On 9/3/2018 I tried unsuccessfully to restore the chart which had disppeared. Nothing else was changed.
|
|
|
|
Post by duwayne on Jun 13, 2017 16:25:23 GMT
Code, I've added a little more explanation to my original post above.
|
|
|
|
ENSO 2017
Jun 13, 2017 16:59:17 GMT
via mobile
Post by acidohm on Jun 13, 2017 16:59:17 GMT
My lead-in to ENSO posts has usually been that "I don't pretend to be able to predict ENSO". I'm going to be a little braver on this post. If the current ENSO path labelled as 2015 on the chart below follows the paths over the 2 previous ENSO paths which started with strong El Ninos we may well see La Nina ONIs later this year. In addition to the cart below there are 3 things which are hinting at cooler temperatures ahead in the (more to come) 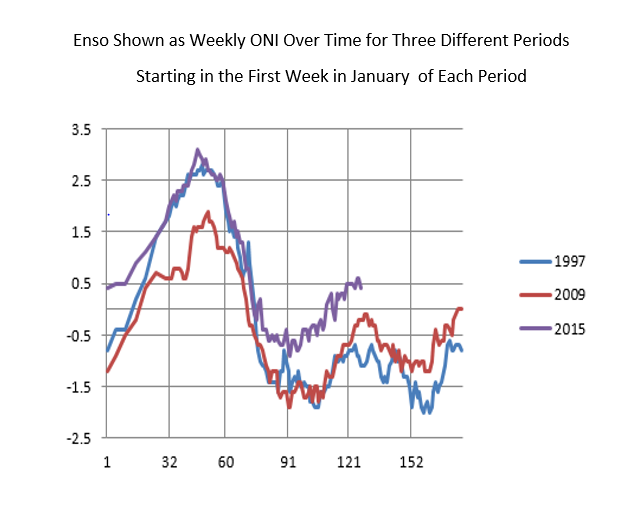 Explanation please? Weeks on bottom? Temp on right? On left 0 is neutral....above 0.5 is nino, below -0.5 is nina |
|
|
|
Post by nautonnier on Jun 13, 2017 17:37:12 GMT
We _are_ in 2017 right? Or has the calendar been adjusted to a lower level? Later edit -- so what you are showing are the years _after_ each El Nino to show how the system returns to null. Of course what may be being shown are different bounce effects. Good wiggle watching though  |
|
|
|
Post by acidohm on Jun 13, 2017 21:15:40 GMT
Noaa have stated most likely outcome is enso neutral till end of year with rising chance of nina.
Pretty much a 180 from 6 weeks ago!
|
|
|
|
Post by missouriboy on Jun 13, 2017 21:28:33 GMT
Did anyone else get just a blob-box where duwayne's graph was supposed to be?
Update: all my photobucket posts are looking like that too. However, I can get to photobucket and view my images. So?
|
|
|
|
Post by sigurdur on Jun 14, 2017 1:06:55 GMT
Did anyone else get just a blob-box where duwayne's graph was supposed to be?
Update: all my photobucket posts are looking like that too. However, I can get to photobucket and view my images. So? Hillary is colluding with the Russians again. |
|
|
|
Post by Ratty on Jun 14, 2017 1:57:24 GMT
Did anyone else get just a blob-box where duwayne's graph was supposed to be?
Update: all my photobucket posts are looking like that too. However, I can get to photobucket and view my images. So? Been having that problem too with Dropbox or Google Photos .... they won't show here. Images from other sources seem to be OK? Anyone see my local radar below?  |
|
|
|
Post by missouriboy on Jun 14, 2017 2:00:15 GMT
Did anyone else get just a blob-box where duwayne's graph was supposed to be?
Update: all my photobucket posts are looking like that too. However, I can get to photobucket and view my images. So? Hillary is colluding with the Russians again. Damn!  |
|
|
|
Post by missouriboy on Jun 14, 2017 2:01:10 GMT
Did anyone else get just a blob-box where duwayne's graph was supposed to be?
Update: all my photobucket posts are looking like that too. However, I can get to photobucket and view my images. So? Been having that problem too with Dropbox or Google Photos .... they won't show here. Images from other sources seem to be OK? Anyone see my local radar below? Yes |
|
|
|
Post by sigurdur on Jun 14, 2017 3:06:18 GMT
Yes
|
|


