|
|
Post by Ratty on Aug 1, 2017 7:48:11 GMT
I think the correct scientific term is piggybacking off the IPCC. |
|
|
|
Post by nautonnier on Aug 1, 2017 11:11:22 GMT
|
|
|
|
Post by nautonnier on Aug 1, 2017 15:57:56 GMT
The question to put is - and why do you consider that dangerous? It has been far warmer than that with higher CO2 concentrations than that and life on earth thrived. So what??
|
|
|
|
Post by missouriboy on Aug 1, 2017 16:47:18 GMT
WIGGLES FOR THE DEDICATED WIGGLE WATCHERAfter watching climate index time series graphs being placed on this thread, I went back to my time series for Columbia, MO. for which I have a daily time series dating back to 1892, and in which I have some faith as it seems to match the longer-term wiggles recorded in historical sources before the days of 'creative' climate science, and summed the number of days by month where maximum temperatures were above the 75th percentile and where minimum temperatures were below the 25th percentile. These, when summed by season and smoothed with a 5-year moving average, are displayed in the two charts below for summer and winter. The first chart highlights the upper quartile and the second, the lower. The Geomagnetic AP Index has been placed in each for reference. I will let the wiggles speak for themselves. There appear to be many lags of different length in the relationship of seasonal upper and lower quartile tallies to the Geo AP Index. It would seem that, as Astro has pointed out, the overall trend is downward since the first half of the Grand Maximum of the 1930s-50s. Notice the current placement and magnitude of summer days > the 75th percentile in relationship to what has happened before, together with where the Geo AP Index is likely going (according to even the conservative experts) ... and these data do not include 2017 yet. These trends will likely look worse 500 miles north. If you do not see ANY relationship to the Geo AP, please schedule a visit to your optometrist.  Or send me. 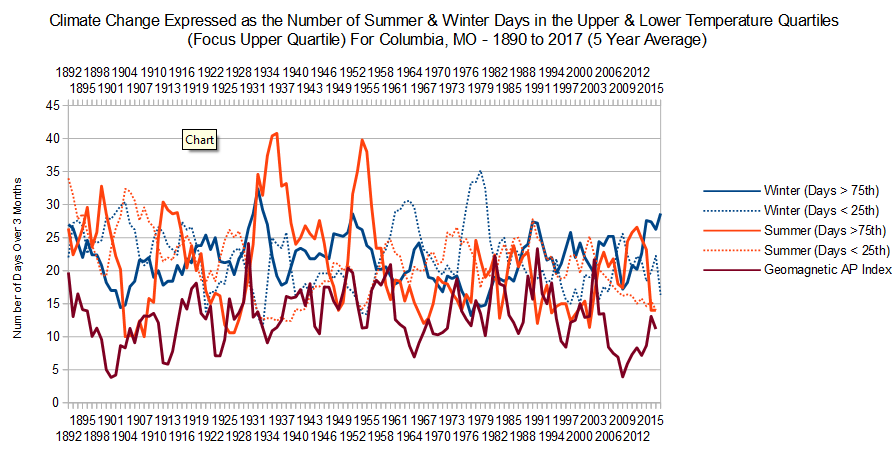 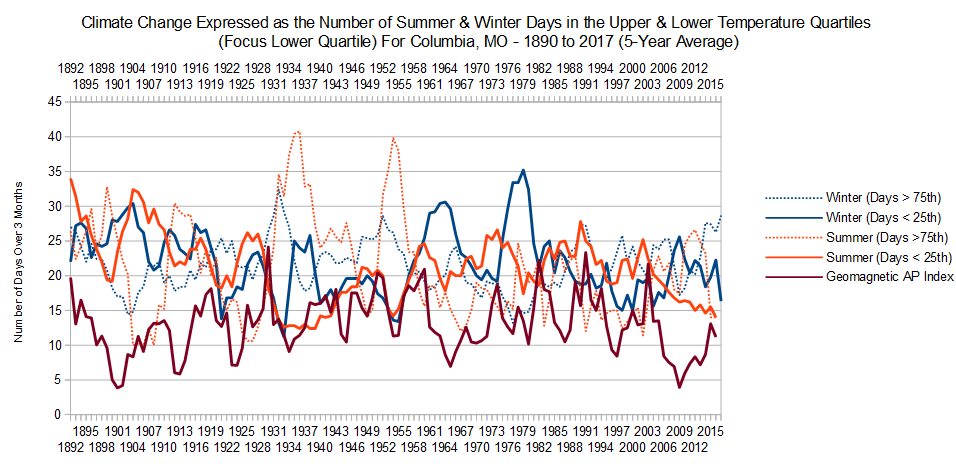
|
|
|
|
Post by Ratty on Aug 1, 2017 22:44:57 GMT
Missouri, as soon as I saw "geomagnetic" I donned my tinfoil hat. Don't worry, I'll be OK .... the vertigo will subside, eventually.  |
|
|
|
Post by missouriboy on Aug 1, 2017 23:50:13 GMT
Missouri, as soon as I saw "geomagnetic" I donned my tinfoil hat. Don't worry, I'll be OK .... the vertigo will subside, eventually. You really should take your dramamine on a regular basis. |
|
|
|
Post by Ratty on Aug 2, 2017 0:10:10 GMT
I already have enough drama in my life.  |
|
|
|
Post by sigurdur on Aug 2, 2017 0:55:56 GMT
I already have enough drama in my life. Wife get her rolling pin out? |
|
|
|
Post by nonentropic on Aug 2, 2017 2:37:51 GMT
never put it away
|
|
|
|
Post by missouriboy on Aug 2, 2017 4:21:43 GMT
Code. Long ago it seems, when I was too busy with other things to feed my interest in climate, I more or less accepted those few parts of the literature I had time to read. Then I retired and started reading. First I was bemused. Then I was dumbfounded. Then I started to actively search out and look at the data for myself. Then I was pissed off and disgusted. In the comments to this post is one by E.M. Smith (Chiefio) regarding the state of the long-term temperature data series and their uses. For those interested in this grisly affair, I copy it in full below. Now, not everyone is or wishes to be a data guy. But it is the basis of the AGW argument together with scraps of theory. It seems to be adjusted on the basis of what the theory says it should look like, and older 'inconvenient' time periods are ignored. It is the ammo they feed their models. The last line says it best ... just look at the data yourself, as I did, if you would find truth. E.M.Smith July 30, 2017 at 7:39 pm Steve: First off, there is only one long duration global temperatures collection. The GHCN. It gets further mollested by others, such as NASA GISS and Hadley to make derivatives. Now there are satellite records, but they are short and recently “revised”. Prior to the revision they were not showing warming… I have looked, in painful depth, at the GHCN and GIStemp derivative. The degree of crap in them is very large. There’s about 4 to 6 years work for you to dig through here: chiefio.wordpress.com/category/ncdc-ghcn-issues/chiefio.wordpress.com/gistemp/chiefio.wordpress.com/category/dtdt/Now the thumbnail sketch is that the average of temperatures in any one place is sometimes going up, sometimes going down, and sometimes going nowhere. In the same place, some temperature averages are rising in some months, dropping in others. In short, the only thing rising is the average, not the actual temperatures. THE big problem with that is just that temperatures lose any meaning AS a temperature when averaged. This is a fundamental physics property of intrinsic vs extrinsic properties and NOT subject to opinion. The “global average temperature” is a meaningless statistic about number collections, but NOT a temperature. chiefio.wordpress.com/2011/07/01/intrinsic-extrinsic-intensive-extensive/The next big hurdle is the “splice artifact”. The way disjoint records are merged to create a series gives a bogus trend where there is none. The GHCN is FULL of disjoint record series and ALL the major trend creation systems create a splice artifact ridden trend out of it. An approachable example of the problem is here: chiefio.wordpress.com/2010/04/03/mysterious-marble-bar/There are LOTS more such problems. (In total, I’ve got about 6 years of such detail collected in various postings.) So IF you wish to claim perfection from GHCN or the derivatives of it, be advised you are by definition refusing to see those realities. That is just being lazy. It is there if you choose to see it. Bottom line: the very idea of a Global Average Temperature is a mistake on the face of it. (So it cannot really be rising).This useless and meaningless statistic is created from biased and inadequate date (violates Nyquist for one), without correct error bands (error is in full degrees F in early records, minimum, and is NOT removed by averaging – see intrinsic property…) , creates false trends from splice artifacts, does urban heat correction backwards, and is prone to repeatedly making fixed recorded past temperatures colder… Yet you choose to believe it without in depth examination. “Good luck with that”. Now, as you prepare to launch a bleat about “peer reviewed climate science”: Please first look up “Climategate”, “Pal Review”, and “editor intimidation”. The very organizations of “Climate Science” were shown corrupt, partisan, and political BY THEIR OWN eMAIL. So instead, just look at the data yourself, as I did, if you would find truth. |
|
|
|
Post by Ratty on Aug 2, 2017 5:57:50 GMT
[ Snip ] Thanks for the reply, I will read your reply with a clear mind tomorrow but right now I'm dead. You moved to Chicago, Code? |
|
|
|
Post by sigurdur on Aug 2, 2017 11:29:59 GMT
Code. Long ago it seems, when I was too busy with other things to feed my interest in climate, I more or less accepted those few parts of the literature I had time to read. Then I retired and started reading. First I was bemused. Then I was dumbfounded. Then I started to actively search out and look at the data for myself. Then I was pissed off and disgusted. In the comments to this post is one by E.M. Smith (Chiefio) regarding the state of the long-term temperature data series and their uses. For those interested in this grisly affair, I copy it in full below. Now, not everyone is or wishes to be a data guy. But it is the basis of the AGW argument together with scraps of theory. It seems to be adjusted on the basis of what the theory says it should look like, and older 'inconvenient' time periods are ignored. It is the ammo they feed their models. The last line says it best ... just look at the data yourself, as I did, if you would find truth. E.M.Smith July 30, 2017 at 7:39 pm Steve: First off, there is only one long duration global temperatures collection. The GHCN. It gets further mollested by others, such as NASA GISS and Hadley to make derivatives. Now there are satellite records, but they are short and recently “revised”. Prior to the revision they were not showing warming… I have looked, in painful depth, at the GHCN and GIStemp derivative. The degree of crap in them is very large. There’s about 4 to 6 years work for you to dig through here: chiefio.wordpress.com/category/ncdc-ghcn-issues/chiefio.wordpress.com/gistemp/chiefio.wordpress.com/category/dtdt/Now the thumbnail sketch is that the average of temperatures in any one place is sometimes going up, sometimes going down, and sometimes going nowhere. In the same place, some temperature averages are rising in some months, dropping in others. In short, the only thing rising is the average, not the actual temperatures. THE big problem with that is just that temperatures lose any meaning AS a temperature when averaged. This is a fundamental physics property of intrinsic vs extrinsic properties and NOT subject to opinion. The “global average temperature” is a meaningless statistic about number collections, but NOT a temperature. chiefio.wordpress.com/2011/07/01/intrinsic-extrinsic-intensive-extensive/The next big hurdle is the “splice artifact”. The way disjoint records are merged to create a series gives a bogus trend where there is none. The GHCN is FULL of disjoint record series and ALL the major trend creation systems create a splice artifact ridden trend out of it. An approachable example of the problem is here: chiefio.wordpress.com/2010/04/03/mysterious-marble-bar/There are LOTS more such problems. (In total, I’ve got about 6 years of such detail collected in various postings.) So IF you wish to claim perfection from GHCN or the derivatives of it, be advised you are by definition refusing to see those realities. That is just being lazy. It is there if you choose to see it. Bottom line: the very idea of a Global Average Temperature is a mistake on the face of it. (So it cannot really be rising).This useless and meaningless statistic is created from biased and inadequate date (violates Nyquist for one), without correct error bands (error is in full degrees F in early records, minimum, and is NOT removed by averaging – see intrinsic property…) , creates false trends from splice artifacts, does urban heat correction backwards, and is prone to repeatedly making fixed recorded past temperatures colder… Yet you choose to believe it without in depth examination. “Good luck with that”. Now, as you prepare to launch a bleat about “peer reviewed climate science”: Please first look up “Climategate”, “Pal Review”, and “editor intimidation”. The very organizations of “Climate Science” were shown corrupt, partisan, and political BY THEIR OWN eMAIL. So instead, just look at the data yourself, as I did, if you would find truth. Thanks for the reply, I will read your reply with a clear mind tomorrow but right now I'm dead. Code: Not to steal Missouri's thunder, I have to agree with him and Chiefco. I am an innovator and am very competitive. I have always felt knowledge gave me an edge. Relying on the expertise of scientists is a bedrock of that knowledge. I am now seasoned enough to know that grants seem to produce the desired outcomes. I have had a buildup of sodium in my soils because of our wet cycle. I had been working with a Professor at NDSU to try and correct the spread. He is a fertility guy. Tried using his ideas to no avail. His grants depend on indicating improving soil health. Found a different soil guy who left working for a private company because he got tired of the false claims put forth by sales. Probed some areas yesterday. Got a kick out of one of his comments. He wanted the tests done in stages so I potentially wouldn't have to spend an extra $50.00. I laughed. Pointed to a spot in my potato field that was sub par. Said I had already invested over $1,000 per acre and the production in that area was going to be dismal. Another $50.00 didn't seem like much. His interest is truly trying to improve soil health while not breaking the bank. Know how he got a grant to do this? He blamed the reduced soil health on AGW. We visited a bit about that. He said he knows AGW has nothing to do with present soil health,but his grant requests had all been denied until he inserted that magical hypothesis. They are now calling the Montana/Dakota's drought a "flash drought". It is a revelation to them that when precipitation declined and stopped that a drought occurred. It happened so "fast". I am seasoned. That is EXACTLY how droughts happen. Have lived through a few of them. The money made via the AGW scenerio is HUGE. Missouri has produced some interesting graphs which actually show what I know from being a farmer for decades and listening to my Grandpa and Father. Observation means nothing to AGW advocacy. Hope you don't break old records in the next few days. Remember, it has never been hot in the PNW. |
|
|
|
Post by Ratty on Aug 2, 2017 12:03:21 GMT
... a paleontologist I lived near some years back said, to get a grant, add " .... as affected by global warming" (or such) to the request. I was already suspicious of the GW story.
|
|
|
|
Post by nautonnier on Aug 2, 2017 12:07:42 GMT
The other thing about GHCN and Meteorological 'average temperatures' is that they are not average temperatures - they are the arithmetic mean of the maximum and minimum observed temperature. This was pointed out in a posting on WUWT. The assumption being that the temperatures at an observation station follow a nice even distribution like a sine wave. This is known to be incorrect but it is what has always been done. Now think of all the 'adjustments' due to Time of Observation TOB. All these were made based on the idea of a nice smooth temperature progression during the day - which as stated above is untrue.
That is before we get onto the issues of enthalpy and the correct units for atmospheric heat content being Joules per Gram (Kilojoules per Kilogram).
Indeed, in every single aspect of data collection and metrics Climate 'scientists' are displaying either abject ignorance or more likely malfeasance.
|
|
|
|
Post by acidohm on Aug 2, 2017 16:52:12 GMT
And why not be patient Code! Too many people have jumped on bandwagons with no clear thought if you ask me!
|
|


 Or send me.


