|
|
Post by sigurdur on Feb 20, 2018 0:31:22 GMT
www.aer.com/science-research/climate-weather/arctic-oscillation/Dr. Judah Cohen from Atmospheric and Environmental Research (AER) recently embarked on an experimental process of regular research, review, and analysis of the Arctic Oscillation (AO). This analysis is intended to provide researchers and practitioners real-time insights on one of North America’s and Europe’s leading drivers for extreme and persistent temperature patterns.
|
|
|
|
Post by Ratty on Feb 20, 2018 0:36:31 GMT
Feb 19 #Records4Day #Sydney, High: 38.3 in 1866, Low: 14.5 in 1887, Rain: 134.6mm in 1959. #Brisbane, High: 37.8 in 1913, Low: 17.4 in 1938, Rain: 63.5mm in 1961. #Canberra, High: 35.6 in 2004, Low: 5.0 in 1954, Rain: 32.5mm in 1945. What is your source, Sig? |
|
|
|
Post by sigurdur on Feb 20, 2018 1:10:56 GMT
There is a daily weather thing about Australia on Twitter.
I can't remember the fellers name that posts every day, will post it here next time I see it.
|
|
|
|
Post by acidohm on Feb 20, 2018 5:54:46 GMT
I told one persistent troll on FB that if he was so sure the cold wasn't coming, he should choose clothes he felt would be most appropriate for next week, and give the rest to charity.... |
|
|
|
Post by Ratty on Feb 20, 2018 8:04:37 GMT
There is a daily weather thing about Australia on Twitter. I can't remember the fellers name that posts every day, will post it here next time I see it. Look familiar? It appears to be from #records4dayFeb 20 #Records4Day #Sydney, High: 40.1 in 1931, Low: 12.1 in 1966, Rain: 82.6mm in 1890. #Brisbane, High: 36.2 in 1925, Low: 15.8 in 2000, Rain: 93.0mm in 1898. #Canberra, High: 35.9 in 1980, Low: 5.7 in 1999, Rain: 69.4mm in 1974. Poster gets the info from The Australian newspaper:  I don't know where The Australian gets its daily records .... haven't noticed the BoM publishing them. |
|
|
|
Post by nautonnier on Feb 20, 2018 13:13:43 GMT
Click on the graphics to get the actual linksOf concern is that if this looks like 1962, then next year could look like 1963 and for UK that was not nice at all. |
|
|
|
Post by nautonnier on Feb 20, 2018 13:18:16 GMT
|
|
|
|
Post by acidohm on Feb 20, 2018 13:22:17 GMT
Sorry Birder, i wasnt suggesting you were trolling earlier 🖒🖒 |
|
|
|
Post by nautonnier on Feb 22, 2018 12:40:25 GMT
|
|
|
|
Post by Ratty on Feb 23, 2018 4:46:34 GMT
Major rain 'event' ongoing here ... and looks like a lot more to come. Small belssing: There isn't a '3' in front of the temperature reading.  |
|
|
|
Post by nautonnier on Feb 23, 2018 11:14:56 GMT
Meanwhile at the other 'end' of the world.... |
|
|
|
Post by mondeoman on Feb 24, 2018 11:01:21 GMT
Would look totally different if they used shades of blue...
|
|
|
|
Post by nautonnier on Feb 24, 2018 11:39:30 GMT
Would look totally different if they used shades of blue... That's the problem with anomaly maps it allows people to put in bright reds even though the temperatures are around 20C below zero 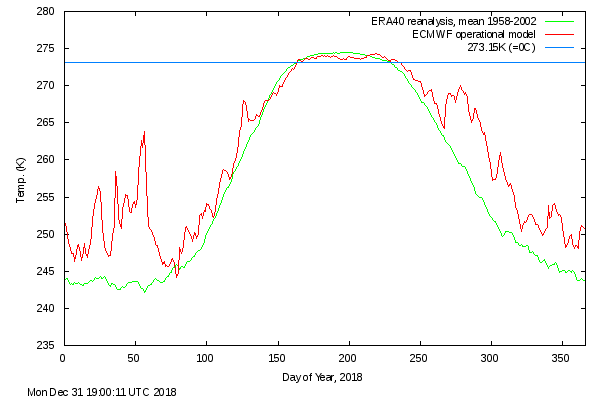 |
|
|
|
Post by missouriboy on Feb 24, 2018 16:15:39 GMT
This one of yours Ratty?
BonnieQueanbeyan,Feb 22 2018 at 2:57am
This is gut-wrenching news and I want to cry. Yet there are still so many people who still deny climate change. What has to happen for them to admit the looming disaster for this planet? Do they simply not care about the world they are leaving to their children and grandchildren? They do not care about the islands that are going to disappear under the waves. I wonder if they will be so complacent when much of Florida and similar locations disappear under water.
And this one? He may want to "tune" his instrument.
BanjoEden,Feb 22 2018 at 4:17pm
I feel the same way, Bonnie. Florida is already in deep trouble. Much of the city is at sea level. Sea level rise has meant that sewage bubbles out on to the pavements and roads. We have been warned. Pandemics will follow.
When will the pandemics start Naut? I need to adjust my schedule ...
|
|
|
|
Post by sigurdur on Feb 24, 2018 17:16:59 GMT
Some say when President Trump was inaugurated.
|
|


