|
|
Post by glc on Jul 16, 2009 8:42:42 GMT
Just a reminder for you, glc: Global mean temperature, on every data set, always follows the ocean temperature, never leads.
Agreed. It's just that the satellites tend to follow a couple of months after the surface record.
Please explain how greenhouse gases create El Ninos. I still don't get it. Thanks in advance
I never said they did.
|
|
|
|
Post by woodstove on Jul 16, 2009 11:05:51 GMT
Just a reminder for you, glc: Global mean temperature, on every data set, always follows the ocean temperature, never leads. Agreed. It's just that the satellites tend to follow a couple of months after the surface record. Please explain how greenhouse gases create El Ninos. I still don't get it. Thanks in advanceI never said they did. What you have said is that carbon dioxide is responsible for a significant portion of what warming we've observed in the past 30 years. What I and others see, meanwhile, is this: Subtract El Ninos from the ocean-atmosphere system and you're left with close to no atmospheric warming. Certainly not enough warming to warrant spending hours a week on a site like this.  Where do the sudden widespread sea surface temperature warmings such as the one we're seeing now come from? Slackened winds and enhanced insolation (such as with El Ninos)? I still fail to see how a trace atmospheric gas produces such effects. Perhaps a diagram? ;D |
|
|
|
Post by socold on Jul 16, 2009 12:22:32 GMT
What I and others see, meanwhile, is this: Subtract El Ninos from the ocean-atmosphere system and you're left with close to no atmospheric warming. Certainly not enough warming to warrant spending hours a week on a site like this. Who are these "others" and where are your numbers? I've done this myself and didn't find "close to no warming" after removing ENSO impact, in fact I found it made very little difference. |
|
|
|
Post by woodstove on Jul 16, 2009 12:47:09 GMT
What I and others see, meanwhile, is this: Subtract El Ninos from the ocean-atmosphere system and you're left with close to no atmospheric warming. Certainly not enough warming to warrant spending hours a week on a site like this. Who are these "others" and where are your numbers? I've done this myself and didn't find "close to no warming" after removing ENSO impact, in fact I found it made very little difference. Who is to decide how to "remove" ENSO impact? Even your beloved RealClimate published a guest opinion this week suggesting that the 1998 El Nino continues to radiate heat through the ocean-atmosphere system. If you can show us the date on which the 1998 El Nino's release of heat into the system stopped, you'll have something worth publishing. |
|
|
|
Post by socold on Jul 16, 2009 13:08:09 GMT
Who are these "others" and where are your numbers? I've done this myself and didn't find "close to no warming" after removing ENSO impact, in fact I found it made very little difference. Who is to decide how to "remove" ENSO impact? Even your beloved RealClimate published a guest opinion this week suggesting that the 1998 El Nino continues to radiate heat through the ocean-atmosphere system. If you can show us the date on which the 1998 El Nino's release of heat into the system stopped, you'll have something worth publishing. Meanwhile your beloved Watts Up With That published some dreary pointless cherrypick about some cold weather somewhere, ignoring the areas of warm weather yet again. The Realclimate piece suggested that the El Nino of 1998 raised temperature to levels ahead of it's time (ahead of trend). I've said as much before in previous posts. In fact I posted the day before the Realclimate article was published that: " There is no 10 year lag. You are taking the 1998 el nino spike as if it is "on trend" and we should have expected warming since then. But in fact it was way ahead of trend and so it would take time before the trend brought another datapoint that high." solarcycle24com.proboards.com/index.cgi?board=globalwarming&action=display&thread=684&page=9#23973The realclimate article a day later writes: " We hypothesize that the established pre-1998 trend is the true forced warming signal, and that the climate system effectively overshot this signal in response to the 1997/98 El Niño." www.realclimate.org/index.php/archives/2009/07/warminginterrupted-much-ado-about-natural-variability/Uncanny? Or not. |
|
|
|
Post by dopeydog on Jul 16, 2009 15:28:08 GMT
That's not what they were saying in 1998 or what Jim Hansen was saying in 2007. Your quote was from an article posted just a few days ago. Even the Mann reference was from 2000 during a particularly cold La Nina, and didn't predict a decade without warming. Agw's have been retrenching on this for 10 years without success. The problem is agw's don't know enough about climate to predict tonights weather much less 50 years from now.
|
|
|
|
Post by socold on Jul 16, 2009 17:37:03 GMT
That's not what they were saying in 1998 or what Jim Hansen was saying in 2007. Your quote was from an article posted just a few days ago. Even the Mann reference was from 2000 during a particularly cold La Nina, and didn't predict a decade without warming. Agw's have been retrenching on this for 10 years without success. The problem is agw's don't know enough about climate to predict tonights weather much less 50 years from now. None of them ever predicted the next decade, so it's a bit rich to claim "none of them predicted a decade without warming" and beside that there hasn't been a decade without warming, warming has continued well into the past decade, for example: 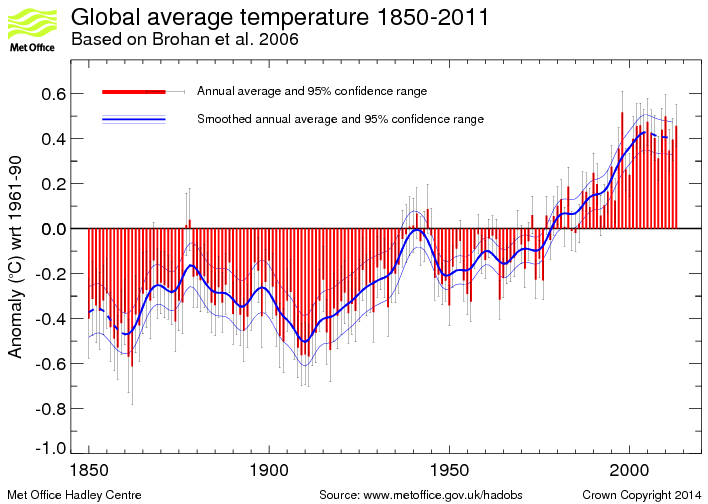 Notice the peak is not in 1998, but around 2005. |
|
|
|
Post by notsocold on Jul 16, 2009 23:44:44 GMT
Yes socold, only yesterday you were quoting 1998 but then GISS rewrote history so now 2005 is the new 1998. We can count on your full compliance to the cause of course. Try using graphs of the real temperatures. The met office, come on, hadcrut and GISS are just plain silly discredited nonsense now.
|
|
|
|
Post by socold on Jul 16, 2009 23:45:50 GMT
Even UAH and RSS show warming continued past 1998
|
|
|
|
Post by notsocold on Jul 16, 2009 23:56:53 GMT
|
|
|
|
Post by socold on Jul 17, 2009 0:28:59 GMT
|
|
|
|
Post by magellan on Jul 17, 2009 1:35:32 GMT
There was no statistical warming in the UAH satellite data from 1979-1997, but rather a step change in 1998. Try that and see what happens  Suddenly your "continuous warming" doesn't look so good.  Something occurred in 1997-1998 that upset the applecart and caused a jump in temperature. There is no "linear" long term trend. |
|
|
|
Post by icefisher on Jul 17, 2009 1:41:05 GMT
Setting 1998 aside as an outlier it looks like continued warming until 2003. But I should note that west coast fishery types noted the change in 1998. And by that I mean not just a return to normal from an unusual event in 1998 but the actual flip of the PDO. It was manifested in datasets by a sudden change in the basin-wide equatorial upper ocean heat content switch that began early in 1998. . . .but also like some have postulated that animals can predict coming earthquakes, perhaps because of high pitched vibrations or something like that manifested by strange behavior on the part of the animals leading up to the events. . . .ocean life was reacting strongly in ways not seen for generations in 1998. What will be telling is what happens over the next 5 years. Does the pattern we see starting now result in a short El Nino followed by an even deeper La Nina than before. . . . repeating the pattern of 1997 through 2001 but amplified towards the cold? Or will it be indicative of continuing up the now much shallower slope of AGW as outlined recently on RC. One thing that appears the least likely is any kind of a return to the warming alarmism of the past decade. That has been all but put to sleep, mercifully. It seems inevitable that much of the warming of the past century is attributable to as Akasofu has postulated. . . .a recovery from the LIA. There may well be a CO2 warming signal in there over the past 60 years but its competing with a solar Grand Maximum for whatever shares there are to be allocated. I doubt anybody can predict which it will be but it should be an interesting ride no matter what. A nice less than "50" solar cycle could really be an eyeopener no matter which direction it goes. |
|
|
|
Post by jimg on Jul 17, 2009 3:23:17 GMT
GLC. the joke you see is that as temperatures get colder, the "corrections" get bigger! Wiggle wiggle...  |
|
|
|
Post by jimg on Jul 17, 2009 3:33:21 GMT
From the GISS site: So the hard data is only used for models, which then create the real data. data.giss.nasa.gov/gistemp/abs_temp.htmlQ. If SATs [surface air temperatures] cannot be measured, how are SAT maps created ? A. This can only be done with the help of computer models, the same models that are used to create the daily weather forecasts. We may start out the model with the few observed data that are available and fill in the rest with guesses (also called extrapolations) and then let the model run long enough so that the initial guesses no longer matter, but not too long in order to avoid that the inaccuracies of the model become relevant. This may be done starting from conditions from many years, so that the average (called a 'climatology') hopefully represents a typical map for the particular month or day of the year.Well, we hope that our improved data is good. Hope is certainly the foundation of science. Or was that faith? |
|


