|
|
Post by crakar24 on Oct 19, 2009 12:33:10 GMT
Heading towards our Summer, maximum temperatures continue well above average in my part of the world while minimums are a little below average. October to date: 28.4 C and 15.1 C October Averages: 26.1 C and 15.8 C Current forecasts suggest the month will continue the trend. South East Queensland. Latitude: 27.39° S Longitude: 153.13° E www.bom.gov.au/climate/dwo/IDCJDW4019.latest.shtmlRatty, Down here in sunny Adelaide winter was a bit warm (splashed all over the news) but spring has been well below average sometimes by 4 or 5 C Cheers Crakar |
|
|
|
Post by trbixler on Oct 19, 2009 14:40:48 GMT
|
|
|
|
Post by trbixler on Oct 20, 2009 12:45:16 GMT
|
|
|
|
Post by poitsplace on Oct 20, 2009 13:32:15 GMT
Surprising to me the records keep coming Lowest max You'd think the climate had hit some kind of tipping point for cooling...almost as if it had changed from a warming cycle to a cooling cycle. |
|
|
|
Post by trbixler on Oct 21, 2009 12:53:02 GMT
|
|
|
|
Post by hilbert on Oct 22, 2009 1:51:11 GMT
Snow on some of the nearby mountains this evening, in central New Mexico, USA.
|
|
|
|
Post by itsthesunstupid on Oct 22, 2009 3:01:50 GMT
Snow on some of the nearby mountains this evening, in central New Mexico, USA. Snow on the west side of the Sandia Mtn Range, visible from my back yard in the foothills of ABQ. It's not unheard of but it is certainly unusal to have snow in area this early in the year. What has been really noticable is the many cloud covered days this year. NM is a "sunshine state" but there has been much cloud cover all year. |
|
|
|
Post by trbixler on Oct 22, 2009 14:05:14 GMT
|
|
|
|
Post by radiant on Oct 22, 2009 15:39:18 GMT
Trbixler There are over 5000 stations with 5000 records for every day of the year in a very large country. A few dozen records on a day does not mean much Anyway if you do all of the lowest minimums and highest maxs for 2009 most months are showing significantly more maximums As i recall maximums win until july and august. September i think shows maximums winning The issue really is do these temperatures mean much? are they useful for a measure of climate change when these places are now developed irrigated communities with their own atmospheric conditions rather than simple towns? Also the issue of different paints today compared to yesteryear is significant for radiative cooling at night when temperatures are measured from inside a painted box - and i am not sure how that factor alters the direction of the data for night cooling or daylight warming when different frequencies are presumably in play. Even today there is still no absolute standard height for a stevenson screen which must make a big difference if the height is changed. These stations are only there to help in weather forcasting day to day and there are many unknowns that make it difficult to compare records over such a very long period of time. |
|
|
|
Post by trbixler on Oct 22, 2009 16:09:44 GMT
radiant www.surfacestations.org/My wife, son and I went out to do one of the surveys in the local mountains. It turned out to have be recently swathed by asphalt . It was not of the highest standard. It appeared that it was originally well sited. It is my impression the surface stations are not the currently maintained with any measure of importance. Meanwhile governments world wide use them as the standard for measuring world temperatures (GISS). Stacking poor measuring on top of poor (at best) historical climate estimates, witness YAD06 from Briffa, and you have the birth of AGW. I understand that checking the mins and maxes may not be any measure of anything but I will note that some of these records have stood for over 100 years. I also note that there is no adjustments for the high maxs due to UHI which should bias the results to more warm the cold but I will note that October has shown some unusual cold records. |
|
|
|
Post by sigurdur on Oct 22, 2009 16:10:47 GMT
Trbixler There are over 5000 stations with 5000 records for every day of the year in a very large country. A few dozen records on a day does not mean much Anyway if you do all of the lowest minimums and highest maxs for 2009 most months are showing significantly more maximums As i recall maximums win until july and august. September i think shows maximums winning The issue really is do these temperatures mean much? are they useful for a measure of climate change when these places are now developed irrigated communities with their own atmospheric conditions rather than simple towns? Also the issue of different paints today compared to yesteryear is significant for radiative cooling at night when temperatures are measured from inside a painted box - and i am not sure how that factor alters the direction of the data for night cooling or daylight warming when different frequencies are presumably in play. Even today there is still no absolute standard height for a stevenson screen which must make a big difference if the height is changed. These stations are only there to help in weather forcasting day to day and there are many unknowns that make it difficult to compare records over such a very long period of time. Radiant: What the sites are showing is the AREA of record lows etc. It isn't in the number, the area of records is quit large. |
|
|
|
Post by radiant on Oct 22, 2009 19:23:06 GMT
|
|
|
|
Post by trbixler on Oct 23, 2009 1:43:16 GMT
another look at early October for the U.S. 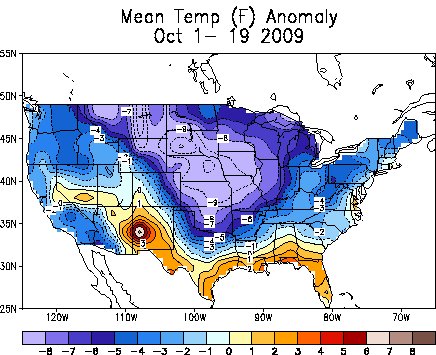 |
|
|
|
Post by trbixler on Oct 23, 2009 12:56:11 GMT
|
|
|
|
Post by murf26 on Oct 23, 2009 13:49:37 GMT
Here in WNC, I counted aboutr 19 fogs in August. The pine cones and oak acorns are very numerous this fall, as are the pokeberries. Didn't find any ground bees this year...they have built their hives up off the ground. Just a couple of things I've noticed that seem to happen when we do have a rough winter!
|
|


