|
|
Post by icefisher on Nov 5, 2009 17:38:45 GMT
Cranking out a calculation on the ocean volume of 1.5billionkm3 it would seem that it would require 640 years of the current AGW effect (Hansen estimate of currently being added by AGW of 9.8E+21joules per year) going into the ocean to warm it on average one degreeC. Even assuming that annual melting of ice restrains the heat distribution by half thats still 320 years. Now we know all about ocean stratifications and thermoclines. . . .er. . . .I mean we know they are there but we don't know diddley on how they operate in the face of changing energy in the ocean. Golly this could this not be the explanation for 200 to 300 year LIA recoveries?  !!! Then if you want to deny the LIA (like GLC likes to question) via long term NW european instrument records that show 100 year shifts in temperature minimums from the 18th to the 19th century as evidence of minimal natural variation. . . .how do we account for how average US temperatures today are actually averaging lower than in the 1930 to 1945 period? Thats an entire continent off the warming track. The cooling track could well be a different ocean providing a differential cooling. Is the globe really warming? Or are we witnessing major scale ocean heat exchanges going on influencing entire continents (it seems we are at a minimum here in the US already 60 years behind on the AGW scale!!!). A 100 years and a significant temperature variance seems almost a given for regional areas most likely from ocean influences!! And if Hansen has the heat gain for the ocean correct and its not showing up in the ARGO float records. . . .that must mean deep ocean heat exchanges going on that are completely unaccounted for in the GCMs, not to speak of what the multi-centennial implications of what that is!! Couple that with how a 10% change in albedo (clouds) is sufficient to throw the globe into a full on ice age; how can we say with any level of confidence we know how these systems work? And GLC complains the GCR record shows little trend but is that an important observation considering the potential for centennial scale delays in warming effects? Cloud models and ocean models are completely missing from GCMs and physically replaced with only simplistic parameterizations influenced only by feedbacks from calculated effects of rising CO2. Just rambling folks but I find these thoughts intriguing. |
|
|
|
Post by steve on Nov 5, 2009 18:36:33 GMT
We know that the temperature of the surface of the ocean is very different from the depths of the ocean. This allows us to put parameters on the amount of ocean mixing. For example, the fact that the ocean surface has warmed nearly a degree in 100 years (while at the same time the net flux has been on average much less than the 9.8e21 joules/year) tells us that there is not very strong coupling between the surface and deep ocean. But if the coupling is weak, and presumably your hypothesis is that the mixing is slowing (allowing the upper surface to warm more than "average" ?) how come the deep ocean heat content has increased as well. I suppose if modelling of the oceans is as crude as is suggested, it ought to be possible to build an ocean model that can periodically bury and then release heat while retaining realistic profiles. So presumably someone has done so? Focusing on the US (still only 2% of the earth's surface) merely illustrates the strong effect that sea surface temperatures has on land temperatures as the anomalies move from west to east and back depending on the differing climate modes in the Atlantic and NE Pacific. Though the average temps throughout the 1930s are not as warm as the past ten years. Putting different decades into here is interesting to see how much natural variation is and to put the apparent warmth of the 1930's into context (set months to Jan - Dec to get whole years): www.esrl.noaa.gov/psd/data/usclimdivs/As for ARGO, there is and always has been "natural variability" in models - even Hansen models. I know people like to ignore this fact, so I have to keep repeating it. So the short period of the ARGO data is not yet inconsistent with the models (when it was showing apparent cooling it was inconsistent), and its observations were both hindcast and forecast to a degree by models a few years ago - these models are now suggesting things will warm up over the next year or so. BTW If folk want to have a discussion about how the data has been modified to fit the agenda, I'm not interested unless the queries are put politely  |
|
|
|
Post by icefisher on Nov 5, 2009 19:02:06 GMT
I was sort of hoping that folks would talk numbers not theory. I tried to lay out a few basic numbers that strongly indicates huge natural variability possibilities and came to a few broad conclusions.
Not too interested in sort of just tossing in doses of theory or any this is bigger than that without actual numbers and time scales as I am not interested in doing everybody's research for them.
The point I was making about US temperatures wasn't that over every chunk of time it wasn't warmer or colder; the point was in the context of GLCs pointing at certain temperature records in NW Europe being indicator that the LIA was only a regional phenomena. Its not the case that NW Europe had zero signal of a LIA it is just the case that for the most part it was untimely.
Thus picking at the US temp record does nothing whatsoever to countermand that point.
|
|
|
|
Post by socold on Nov 5, 2009 19:44:09 GMT
I calculated exactly 640 years too
|
|
|
|
Post by steve on Nov 6, 2009 12:36:39 GMT
Here are some figures:
To warm the top 10 metre of the ocean by 0.8 degrees (the approximate rise in sea surface temperatures over 100 years) it takes roughly 1e22 Joules, about the same amount of energy as the calculated annual flux for the 10 year "Hansen" period (which I accept looks higher than the longer term average).
That it was possible to warm the surface so much without warming the depths by a similar amount is evidence that the rate of energy movement from the near surface to the deep ocean can be slow.
Therefore, if the warming resumes at or near the "Hansen" rate, it is possible that a significant fraction of the roughly 9.8e21 Joules per year observed positive flux will stay near to the surface for at least another century.
If one percent stays in the top 10 metres, the sea surface temperature will warm by 1C by 2100. If it is 2%, then the warming will be 2C.
So I would suggest that the 640 year period is not relevant. More relevant is, perhaps, the rate at which the ocean can "bury heat". Maybe a level by level analysis of the ocean heat content data would provide more info.
|
|
|
|
Post by hunter on Nov 6, 2009 13:26:04 GMT
Here are some figures: To warm the top 10 metre of the ocean by 0.8 degrees (the approximate rise in sea surface temperatures over 100 years) it takes roughly 1e22 Joules, about the same amount of energy as the calculated annual flux for the 10 year "Hansen" period (which I accept looks higher than the longer term average). That it was possible to warm the surface so much without warming the depths by a similar amount is evidence that the rate of energy movement from the near surface to the deep ocean can be slow. Therefore, if the warming resumes at or near the "Hansen" rate, it is possible that a significant fraction of the roughly 9.8e21 Joules per year observed positive flux will stay near to the surface for at least another century. If one percent stays in the top 10 metres, the sea surface temperature will warm by 1C by 2100. If it is 2%, then the warming will be 2C. So I would suggest that the 640 year period is not relevant. More relevant is, perhaps, the rate at which the ocean can "bury heat". Maybe a level by level analysis of the ocean heat content data would provide more info. But the fact is that the oceans are gaining heat at a small fraction of the Hansen rate. Instead of talking about what will happen if they heat at his failed prediction, why not talk about what will happen when the ocean heats as they actually are heating? Oh, that's right: because then there would be no fear to sell, or taxes to raise. |
|
|
|
Post by steve on Nov 6, 2009 17:17:47 GMT
Hunter, it wasn't a prediction, it was an observation.
Icefisher's starting position is to look at what happens *if* heating continues at the Hansen rate. So slighly predictable comments about tax and fear might be better reserved for the politics and Copenhagen threads.
|
|
|
|
Post by magellan on Nov 6, 2009 17:45:16 GMT
Here are some figures: To warm the top 10 metre of the ocean by 0.8 degrees (the approximate rise in sea surface temperatures over 100 years) it takes roughly 1e22 Joules, about the same amount of energy as the calculated annual flux for the 10 year "Hansen" period (which I accept looks higher than the longer term average). That it was possible to warm the surface so much without warming the depths by a similar amount is evidence that the rate of energy movement from the near surface to the deep ocean can be slow. Therefore, if the warming resumes at or near the "Hansen" rate, it is possible that a significant fraction of the roughly 9.8e21 Joules per year observed positive flux will stay near to the surface for at least another century. If one percent stays in the top 10 metres, the sea surface temperature will warm by 1C by 2100. If it is 2%, then the warming will be 2C. So I would suggest that the 640 year period is not relevant. More relevant is, perhaps, the rate at which the ocean can "bury heat". Maybe a level by level analysis of the ocean heat content data would provide more info. And you actually believe basic physics supports the notion that an additional ~95 ppm CO2 into the atmosphere can result in even a measurable portion of ocean warming? Oh my.... |
|
|
|
Post by icefisher on Nov 6, 2009 21:30:16 GMT
Here are some figures: To warm the top 10 metre of the ocean by 0.8 degrees (the approximate rise in sea surface temperatures over 100 years) it takes roughly 1e22 Joules, about the same amount of energy as the calculated annual flux for the 10 year "Hansen" period (which I accept looks higher than the longer term average). That it was possible to warm the surface so much without warming the depths by a similar amount is evidence that the rate of energy movement from the near surface to the deep ocean can be slow. Therefore, if the warming resumes at or near the "Hansen" rate, it is possible that a significant fraction of the roughly 9.8e21 Joules per year observed positive flux will stay near to the surface for at least another century. If one percent stays in the top 10 metres, the sea surface temperature will warm by 1C by 2100. If it is 2%, then the warming will be 2C. So I would suggest that the 640 year period is not relevant. More relevant is, perhaps, the rate at which the ocean can "bury heat". Maybe a level by level analysis of the ocean heat content data would provide more info. Those were the rock and roll days of AGW! When you could just slide the button on the ocean warming penetration by a factor of 100 in the model parameterization and get a fit! Now with some observations its a bit tougher to make that case with the oceans actually likely cooling. . . .or maybe warming at .003degC per year. . . .take your pick! |
|
|
|
Post by steve on Nov 7, 2009 13:38:01 GMT
I can't do any more than "slide the button" because I don't have the time to analyse the data. We do have data and someone could do the analysis to work out approximately where the button ought to be.
The point is that you are *assuming* that since I cannot tell you where the button is, the button must be near 0% - ie. all heat absorbed by the oceans is quickly mixed into the whole ocean. However, the evidence from the last 100 years is clearly that this cannot be the case.
The basis of your thread was that the Hansen rate of warming could not produce the projected ocean warming in under 640 years. If you want to change the subject and say that the last 5 years data are more significant than the last 50 or 100 so the thread discussion is irrelevant, then that's your prerogative - it's your thread.
|
|
|
|
Post by icefisher on Nov 7, 2009 15:25:32 GMT
I can't do any more than "slide the button" because I don't have the time to analyse the data. We do have data and someone could do the analysis to work out approximately where the button ought to be. The point is that you are *assuming* that since I cannot tell you where the button is, the button must be near 0% - ie. all heat absorbed by the oceans is quickly mixed into the whole ocean. However, the evidence from the last 100 years is clearly that this cannot be the case. The basis of your thread was that the Hansen rate of warming could not produce the projected ocean warming in under 640 years. If you want to change the subject and say that the last 5 years data are more significant than the last 50 or 100 so the thread discussion is irrelevant, then that's your prerogative - it's your thread. It does seem a bit implausible that the heat can disappear into the deep ocean and then reemerge at the surface unmixed to continue its warming. But that is the logical fact that must be true if the IPCC estimates of future warming are accurate. You are wrong that this thread is about the Hansen rate of warming could not produce the projected (IPCC?) warming in under 640 years. This thread is about the fact that one cannot project future warming unless one has both an accurate ocean model and an accurate cloud model. I mean can you produce a graph of the warming that corresponds to the facts? Seems all we see are graphs that continue to rely on biased reconstructions of past temperatures that don't have repeated instances of recent variations, even while armies of statisticians are running around pooh poohing recent cooling by saying the recent cooling is not unusual in that it has happened many times in the past. There seems to be a divergence problem not just emerging in past temperature reconstructions but in the oceans and logic behind AGW as well. |
|
|
|
Post by socold on Nov 7, 2009 15:28:07 GMT
I doubt any of us have even basic familiarity with the state of ocean models, so this discussion is a bit like trying to wring knowledge from complete ignorance.
|
|
|
|
Post by steve on Nov 7, 2009 17:35:44 GMT
I can't do any more than "slide the button" because I don't have the time to analyse the data. We do have data and someone could do the analysis to work out approximately where the button ought to be. The point is that you are *assuming* that since I cannot tell you where the button is, the button must be near 0% - ie. all heat absorbed by the oceans is quickly mixed into the whole ocean. However, the evidence from the last 100 years is clearly that this cannot be the case. The basis of your thread was that the Hansen rate of warming could not produce the projected ocean warming in under 640 years. If you want to change the subject and say that the last 5 years data are more significant than the last 50 or 100 so the thread discussion is irrelevant, then that's your prerogative - it's your thread. It does seem a bit implausible that the heat can disappear into the deep ocean and then reemerge at the surface unmixed to continue its warming. But that is the logical fact that must be true if the IPCC estimates of future warming are accurate. You are wrong that this thread is about the Hansen rate of warming could not produce the projected (IPCC?) warming in under 640 years. This thread is about the fact that one cannot project future warming unless one has both an accurate ocean model and an accurate cloud model. OK. But we are never going to agree on how good a model has to be to be useful, because the opinion here seems to be that if a model is used it must be wrong (unless it's a Spencer model). The main part of the original post though was based quite strongly on the 640 years. As I predicted, when the subject gets away from you the "biased" temperature reconstruction argument comes up. Obviously all the ocean measurements of the last 200 years have been deliberately tied to one tree. |
|
|
|
Post by icefisher on Nov 7, 2009 19:18:38 GMT
As I predicted, when the subject gets away from you the "biased" temperature reconstruction argument comes up. Obviously all the ocean measurements of the last 200 years have been deliberately tied to one tree. Bias is endemic in the system. Its a shame but thats really the state of the situation. What you failed to do is construct a graph of recent warming tied to these fluctuating 30 year periods of warming and cooling that continues to suggest it is going to get warmer by the range of amounts suggested by the IPCC. . . .ala Akasofu as requested. Yeah indeed that underlying slope of current warming may have an AGW element to it. But one needs to first construct the graph with slopes attributed to the now widely acknowledged short term warming and cooling patterns and the longterm warming and cooling patterns that single trees and California burls were deployed to minimize ideally without those artifices. Should be simple Steve so why not produce a graph of resolution equivalent to Akasofu's that you ascribe to with whatever backup it has with it? I don't think hiding behind a skirt of suggesting someone is denying science without first producing something somebody can deny. Nobody wants to stand behind bristlecone/foxtails, or single trees in Yamal, or upside down Mann so the AGW advocates have largely been reduced to not advocating such graphics but continuing to broadly point to the warming they suggest with a sweeping handwave across it all. I mean where is the beef Steve? |
|
|
|
Post by steve on Nov 8, 2009 12:06:21 GMT
The following Smith et al decadal predictions show that less warming or cooling over a few years can be exhibited by a model forced with greenhouse gases at the current rate. 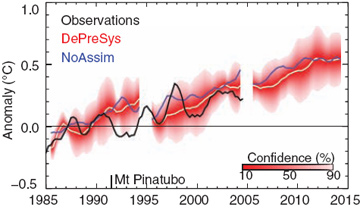 This has come up before quite regularly here. Don't read more into the plot than there is - getting the ocean state about right to produce some (limited) short term skill is different from saying that the model will correctly predict the long term warming trend. The illustration shows only that the short term trends *can be* larger than the long term warming that the model exibits. |
|


 !!!
!!!
