|
|
Post by icefisher on Nov 8, 2009 18:59:10 GMT
The following Smith et al decadal predictions show that less warming or cooling over a few years can be exhibited by a model forced with greenhouse gases at the current rate. 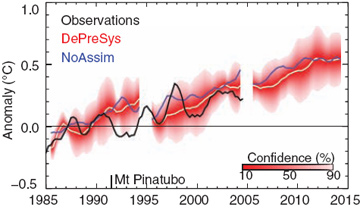 This has come up before quite regularly here. Don't read more into the plot than there is - getting the ocean state about right to produce some (limited) short term skill is different from saying that the model will correctly predict the long term warming trend. The illustration shows only that the short term trends *can be* larger than the long term warming that the model exibits. Thats not exactly was I was asking for. A start date somewhere at least as far back as 1800's and extending out to the IPCC prediction period, ala Akasofu with the observation period extended to the current date not cut off in 2004. As important as this topic is certainly somebody took a few of those billions in research dollars and put something together that still defensible. You certainly don't have to agree with Akasofu but just be prepared to defend what you post. The reason I am asking for that is primarily you need to deal with the general warming from the LIA or at least the Dalton minimum in addition to the intermittant cooling periods and demonstrate that the recent warming period is in someway unnatural. Of particular note would be the general cooling trends of the late 19th century and post 1940 and how your models adjusted to those observations. Continuing to ride the crest of the warming beginning in 1980 is exactly what the Akasofu graph exposes and it remains hidden in your graph. Obviously an argument that the slope of observations continues back in time perhaps merely at a lower slope does not hold water with the observations. Changing temperatures is clearly not just due to CO2 and that must be accounted for. I understand that the team has had major difficulties with this and as such attempted to foist less than good science to support the idea that such past variations did not exist or were greatly diminished. Hopefully we don't have to go back and argue those points though I realize that there may be some difference of opinion on the scale of the LIA and MWP, its certainly not what we have seen come out of the team and used without question by the IPCC. Your graph is interesting but hardly covers sufficient ground to stand the test of time. I don't want a razor thin patty of beef in my burger. I want something I can get my teeth into. Keyhole shots of longterm climate variation just don't cut it anymore. |
|
|
|
Post by spaceman on Nov 9, 2009 3:57:29 GMT
their answer Will be, in a round about way, after arguing about how the data was obtained, etc, etc: The LIA, MWP, and other periods of cold and warm didn't happen.
|
|
|
|
Post by steve on Nov 9, 2009 11:11:15 GMT
Icefisher,
The proposition is that there is a warming trend in line with increased levels of greenhouse gas but moderated or modified by other forcings and by natural variability.
It would be nice to be able to perfectly model the exact variability, but to do so you need a perfect model, a perfect initial state and perfect boundary conditions. That we do not have these things even now is clearly illustrated in the plot I showed, and prior to the satellite and modern instrument era we are relying on even less.
The Akasofu plot takes nothing of this into account and simply relies on a straight line through a deliberately limited set of observations. The evidence that Akasofu removed from his plot is that prior to 1880 it did *not* get as cold as Akasofu's line. He has also significantly enhanced the warmth of the 1940's period to make it look more anomalous. The evidence *since* the Akasofu plot is going *against* his plot not for it.
So I object to the Akasofu plot for not being based on any meaningful physics, and modifying the evidence that doesn't support it. There are a lot of criticisms of alleged deletion and modification of data on this forum - I would expect Akasofu to be held to the same standards.
|
|
|
|
Post by icefisher on Nov 9, 2009 12:22:12 GMT
Icefisher, The proposition is that there is a warming trend in line with increased levels of greenhouse gas but moderated or modified by other forcings and by natural variability. It would be nice to be able to perfectly model the exact variability, but to do so you need a perfect model, a perfect initial state and perfect boundary conditions. That we do not have these things even now is clearly illustrated in the plot I showed, and prior to the satellite and modern instrument era we are relying on even less. The Akasofu plot takes nothing of this into account and simply relies on a straight line through a deliberately limited set of observations. The evidence that Akasofu removed from his plot is that prior to 1880 it did *not* get as cold as Akasofu's line. He has also significantly enhanced the warmth of the 1940's period to make it look more anomalous. The evidence *since* the Akasofu plot is going *against* his plot not for it. So I object to the Akasofu plot for not being based on any meaningful physics, and modifying the evidence that doesn't support it. There are a lot of criticisms of alleged deletion and modification of data on this forum - I would expect Akasofu to be held to the same standards. Physics has nothing to do per se. Its fine to meld something based upon physics into your work. But all you have shown me is your man-made prediction riding an observation history that clearly is the upside of a natural warming wave. Its not fair to criticize Akasofu for poor science without offering better science. IPCC AR4 claims to have done so but relied upon bristlecone/foxtails, a single tree in Yamal, and a non-replicable value added historical temperature record. In other words it lacks any shred of scientific credibility. So I was interested in the backstop you warmers are relying upon. Once again where is the beef? |
|
|
|
Post by steve on Nov 9, 2009 13:01:25 GMT
Since you should know by now that the science relies on more than a recent correlation, that the prediction of warming preceded the warming, that the IPCC projections do not even depend on the non-existence of the MWP let alone one tree that was first evaluated many years after the first IPCC report, I have to assume you have moved on from evaluation of our physical understanding of the oceans.
It's not fair to hold up Akasofu's plot as science when you know it is guilty of massaging the data. Is your only hope to prove that all scientists are as bad as Akasofu?
|
|
|
|
Post by sigurdur on Nov 9, 2009 13:21:18 GMT
Since you should know by now that the science relies on more than a recent correlation, that the prediction of warming preceded the warming, that the IPCC projections do not even depend on the non-existence of the MWP let alone one tree that was first evaluated many years after the first IPCC report, I have to assume you have moved on from evaluation of our physical understanding of the oceans. It's not fair to hold up Akasofu's plot as science when you know it is guilty of massaging the data. Is your only hope to prove that all scientists are as bad as Akasofu? A poor paper is a poor paper. Akasofu is in the same league as Briffa, Mann etc. The poor subjective reasoning and examination of data by all involved, pro and con AGW, requires a total cleaning of the house per se. Politics got involved, and science left the room. |
|
|
|
Post by woodstove on Nov 9, 2009 14:32:11 GMT
Since you should know by now that the science relies on more than a recent correlation, that the prediction of warming preceded the warming, that the IPCC projections do not even depend on the non-existence of the MWP let alone one tree that was first evaluated many years after the first IPCC report, I have to assume you have moved on from evaluation of our physical understanding of the oceans. It's not fair to hold up Akasofu's plot as science when you know it is guilty of massaging the data. Is your only hope to prove that all scientists are as bad as Akasofu? A poor paper is a poor paper. Akasofu is in the same league as Briffa, Mann etc. The poor subjective reasoning and examination of data by all involved, pro and con AGW, requires a total cleaning of the house per se. Politics got involved, and science left the room. I must have missed something. Has Akasofu been discredited by something other than Steve's opinion? Links please. |
|
|
|
Post by icefisher on Nov 9, 2009 14:32:41 GMT
Since you should know by now that the science relies on more than a recent correlation, that the prediction of warming preceded the warming, that the IPCC projections do not even depend on the non-existence of the MWP let alone one tree that was first evaluated many years after the first IPCC report, I have to assume you have moved on from evaluation of our physical understanding of the oceans. It's not fair to hold up Akasofu's plot as science when you know it is guilty of massaging the data. Is your only hope to prove that all scientists are as bad as Akasofu? So what you are saying is you have no beef in your argument for global warming? I can accept that. Bottom line is a physical theory has to be tested against observations. Its like spitting in the wind otherwise. Theoretically from basic theory of the speed of your spit, ignoring the real world you could claim to be able to spit on Mars from your front porch. You say Akasofu massaged the data and raised the level of 1940 temps. what is your evidence of that. |
|
|
|
Post by steve on Nov 9, 2009 14:44:56 GMT
I said the other day that the data looked like HadCRUT3, and noone disputed that. I linked to HadCRUT3 and invited people to suggest the start and end points of a trend line that would make the plot look like the Akasofu plot, since I couldn't find an appropriate line. As is common when I make a challenge that requires a bit of thought, things went quiet. So here's the plot (bottom of the three).  Give me the start and end points that qualitatively and quantitavely match this:  |
|
|
|
Post by icefisher on Nov 9, 2009 17:42:03 GMT
I said the other day that the data looked like HadCRUT3, and noone disputed that. I linked to HadCRUT3 and invited people to suggest the start and end points of a trend line that would make the plot look like the Akasofu plot, since I couldn't find an appropriate line. As is common when I make a challenge that requires a bit of thought, things went quiet. What scientific crediblity can you lend to Hadcrut? It has Briffa's work all over it and Jones let his dog eat the underlying data. |
|
|
|
Post by steve on Nov 9, 2009 17:54:04 GMT
If you are happy to admit that Akasofu's plot is based on a massaged version of incorrect data then just say so.
|
|
|
|
Post by socold on Nov 9, 2009 19:56:03 GMT
I think the main problem with Akasofu's graph is not the temperature record used, but the assumption over the shape of the background trend. Why linear and not curved? A slight curve in either direction would change the projection significantly. For example, take the IPCC projected curve and project it back through the 20th century.
|
|
|
|
Post by icefisher on Nov 9, 2009 20:47:45 GMT
I think the main problem with Akasofu's graph is not the temperature record used, but the assumption over the shape of the background trend. Why linear and not curved? A slight curve in either direction would change the projection significantly. For example, take the IPCC projected curve and project it back through the 20th century. A straight line is a very good one considering the caveats that Akasofu noted in his work. He has curves for the short term variation but did not go so far as to claim the natural curve from the LIA on the basis we know so little about it. Even if you allow a teensy bump in the LIA recovery it subtracts mightily from historic effects of CO2 emissions I heard folks argue it already ended but there is no physical evidence for that and in fact if you look carefully and compare it to the transition from the MWP to the LIA it might have another hundred years to go before it does curve downward. |
|
|
|
Post by icefisher on Nov 9, 2009 20:50:27 GMT
If you are happy to admit that Akasofu's plot is based on a massaged version of incorrect data then just say so. You forgot to mention it was different. So you must mean a massaged version of the massaged version. Ever consider it was the unmassaged version? p.s. Did your research for you Steve. Akasofu's graph does not come from Hadcrut but comes from a Japanese government climate site, including the linear line. Akasofu extended the linear line both directions outside of the observation window he drew off the Japanese work. people.iarc.uaf.edu/~sakasofu/pdf/global_temperature_change.pdfDo you suppose maybe the Japanese used the raw data and Briffa and Jones curved it? |
|
|
|
Post by icefisher on Nov 10, 2009 1:01:22 GMT
Here is more for you Steve.
From Akasofu on the use of the linear line for approximating temperature change:
Bryant (1997) showed statistically that the linear approximation
is accurate, with only a few points being outside 95% confidence limits.
Bryant, E. 1997. Climate Process and Change. Cambridge University Press
|
|


