|
|
Post by missouriboy on Dec 5, 2018 1:33:18 GMT
OK I hope this is a simple question The current method of obtaining a daily 'average' 'temperature' is to take the highest temperature recorded and the lowest temperature recorded in a day. Then the mean of those two numbers is calculated and called (incorrectly) the daily average. I say incorrectly as spikes up and spikes down are given the same weight as 12 hours at a temperature But that is not my query.  If I have a month where the top temperature is 20C every day but the lowest temperature is 5C, 5.1C, 5.2C, 5.3C, 5.4C, 5.5C, 5.6C. The mean will be 12.5, 12.55, 12.6, 12.65 etc This means a rise in the mean of the two temperatures by 0.05C So do the climate 'scientists' then add that 0.05C as a daily rise to the top temperature as a linear projection claiming that "the temperature" will rise by 7*0.05 -> 0.35C every week? Or do they say more correctly that the top temperature will remain at 20C as it has for the last week? I have a suspicion that they use the rise in daily mean, rather than the top or bottom observations. Ask Harry? This Harry? |
|
|
|
Post by nonentropic on Dec 5, 2018 1:36:50 GMT
yes they do but that is not incorrect so long as that is understood.
In fact the US data shows a warming of the lows and not the highs. What is a straight lie is to claim that we will cook as a consequence. The climate would in fact be more temperate.
The CAGW story is all about the big C in CAGW not the AGW which may or may not be measurable but without the C its not a cause for massive expenditure.
|
|
|
|
Post by nautonnier on Dec 5, 2018 3:05:27 GMT
yes they do but that is not incorrect so long as that is understood. In fact the US data shows a warming of the lows and not the highs. What is a straight lie is to claim that we will cook as a consequence. The climate would in fact be more temperate. The CAGW story is all about the big C in CAGW not the AGW which may or may not be measurable but without the C its not a cause for massive expenditure. I do not believe that it is understood - it is definitely not the way that the 'temperature rise' is sold to the general population. Not having so many frosts is a lot different to more 35C days. Yet I have only seen the 'more 35C days' as headlines. |
|
|
|
Post by sigurdur on Dec 5, 2018 8:59:03 GMT
|
|
|
|
Post by Ratty on Dec 5, 2018 12:21:02 GMT
yes they do but that is not incorrect so long as that is understood. In fact the US data shows a warming of the lows and not the highs. What is a straight lie is to claim that we will cook as a consequence. The climate would in fact be more temperate. The CAGW story is all about the big C in CAGW not the AGW which may or may not be measurable but without the C its not a cause for massive expenditure. My amateur investigation of Aussie temps indicates that the lows are trending higher with indiscernible trends in the highs. In fact, most of the long term stations - away from UHIs - show a slight cooling trend in TMax. Speaking of UHI ...... an acquaintance has done detailed historical research on Sydney's Observatory Hill AWS and concludes that upward trends in TMax there can be explained by various physical factors. Sydney Observatory where warming is created by site moves, buildings, freeways |
|
|
|
Post by missouriboy on Dec 5, 2018 16:14:31 GMT
Trend estimates are somewhat sensitive to homogeneity assessment choices, but all investigated radiosonde data sets suggest a change from late twentieth century cooling to early 21st century warming in the lower stratosphere, which is consistent with a reversal from ozone depletion to recovery from the effects of ozone‐depleting substances.
Could this have anything to do with a ramped up sun over the last 9 solar cycles?
|
|
|
|
Post by sigurdur on Dec 5, 2018 16:20:19 GMT
A combination of both perhaps?
|
|
|
|
Post by nautonnier on Jan 3, 2019 11:33:29 GMT
|
|
|
|
Post by nautonnier on Jan 3, 2019 12:53:36 GMT
An interesting set of papers here: " Holocene Climate Pattern Recognition Paper Series Abstract of the Holocene paper series Features and application of the Climate Pattern Recognition method for evaluating temperature evolution in Holocene time series are explained. This study recognizes four distinct climate patterns: a multi-millennial pattern, two multi-centennial patterns and one short multi-decadal pattern. Special attention is given to peak temperature spikes. The analysis is able to distinguish different causes of climate change out from Holocene temperature graphs, such as the Milankovitch cycle, Earth orbit oscillations, cosmic meteor impacts on Earth and likely volcano mega-eruptions. We use the graphical version of the GISP2 data set transformed into equidistant time intervals of 10 years for visual demonstration of climate patterns. Each up and down of the GISP2 temperature curve is explained in detail. We were able to identify the causes for cyclic Bond events and causes for other cyclic temperature oscillations in the Holocene. A well-defined continuous multi-centennial Holocene cycle with 7-year growing periods is proven for the entire Holocene. Its exact timing of the cycle excludes an internal atmospheric-oceanic cycle cause. The pattern recognition method determines the indisputable celestial origin of cyclic patterns and is superior to GCM/PMIP/CMIP models, which all underperformed in recent 2014 model-data comparisons. The entire series contains 8 papers, which will be added successively. 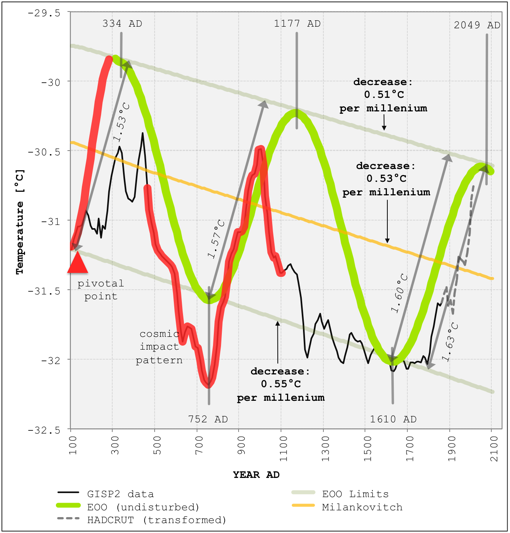 www.knowledgeminer.eu/climate/papers.html www.knowledgeminer.eu/climate/papers.html |
|
|
|
Post by nautonnier on Jan 5, 2019 15:14:36 GMT
|
|
|
|
Post by blustnmtn on Jan 5, 2019 15:26:39 GMT
I was there in January 1983 and it wasn’t warm then either. |
|
|
|
Post by Ratty on Jan 6, 2019 0:11:45 GMT
An interesting set of papers here: " Holocene Climate Pattern Recognition Paper Series Abstract of the Holocene paper series Features and application of the Climate Pattern Recognition method for evaluating temperature evolution in Holocene time series are explained. This study recognizes four distinct climate patterns: a multi-millennial pattern, two multi-centennial patterns and one short multi-decadal pattern. Special attention is given to peak temperature spikes. The analysis is able to distinguish different causes of climate change out from Holocene temperature graphs, such as the Milankovitch cycle, Earth orbit oscillations, cosmic meteor impacts on Earth and likely volcano mega-eruptions. We use the graphical version of the GISP2 data set transformed into equidistant time intervals of 10 years for visual demonstration of climate patterns. Each up and down of the GISP2 temperature curve is explained in detail. We were able to identify the causes for cyclic Bond events and causes for other cyclic temperature oscillations in the Holocene. A well-defined continuous multi-centennial Holocene cycle with 7-year growing periods is proven for the entire Holocene. Its exact timing of the cycle excludes an internal atmospheric-oceanic cycle cause. The pattern recognition method determines the indisputable celestial origin of cyclic patterns and is superior to GCM/PMIP/CMIP models, which all underperformed in recent 2014 model-data comparisons. The entire series contains 8 papers, which will be added successively. www.knowledgeminer.eu/climate/papers.htmlCould someone please let me have a summary of those papers? Tomorrow will be fine.  |
|
|
|
Post by missouriboy on Jan 6, 2019 3:41:37 GMT
They are really very short Ratty. I "stole" all of them except the paywalled ones. |
|
|
|
Post by Ratty on Jan 6, 2019 5:48:54 GMT
They are really very short Ratty. I "stole" all of them except the paywalled ones. When will your summary be ready then? |
|
|
|
Post by nautonnier on Feb 2, 2019 10:51:50 GMT
Another set of temperature records that seems to show that the series of minima after the 'warm periods' are following the same decline in temperatures. This from WUWT. Note the series of minima before the rise to the next 'optimum'.  Projected into the future it looks like things could go to cold after this warm phase and IF the previous series is repeated then it cold get colder than the LIA. |
|


