|
|
Post by duwayne on Feb 20, 2021 21:24:34 GMT
If I understand your response correctly, you didn’t find anything which shows the “placenta spike” is similar to the COVID spike. This would alleviate that concern. You indicate that in your search you did find other things of concern and the most concerning was antibody dependent enhancement (ADE). I followed up on your link and it seemed to me they are talking about a weakened virus injection which isn’t the case with the Moderna or Pfizer vaccine. Can you maybe give a little more detail on your ADE concern and what vaccine this applies to? The concern is for all the mRNA 'vaccines'. The mRNA causes the host cells to generate spike protein that is intended to be identical to the viral spike proteins. These viral spikes have to remain constant as they dock onto the ACE2 receptor sites on epithelial and endothelial cells. Any significant change and the virus cannot infect the body. However, it also means that the antibodies generated by the body will be built to precisely match the vaccine mRNA generated spike protein. In previous attempts at doing this the antibodies may not completely block the ACE2 receptor and the phagocytes that attempt to absorb and destroy the virus can be infected this can lead to rapid destruction of the adaptive immune system and a cytonkine storm. This was the reason previous attempts at corona virus vaccines were abandoned in animal studies. There is a better article than this which I couldn't find again in my quick search, but this link describes generally how the problems of the earlier mRNA vaccines were overcome and how Moderna avoided the problems with the old animal studies that you mention above. linkThis may or may not resolve the ADE issue, but I couldn't understand what you said above. Can you link the article which provides the science behind the ADE concern which may remain after the Moderna mRNA "fix"? I don't want to continue recommending the mRNA vaccines if there really is a problem. |
|
|
|
Post by duwayne on Feb 20, 2021 1:50:49 GMT
If I understand your response correctly, you didn’t find anything which shows the “placenta spike” is similar to the COVID spike. This would alleviate that concern. You indicate that in your search you did find other things of concern and the most concerning was antibody dependent enhancement (ADE). I followed up on your link and it seemed to me they are talking about a weakened virus injection which isn’t the case with the Moderna or Pfizer vaccine. Can you maybe give a little more detail on your ADE concern and what vaccine this applies to? |
|
|
|
Post by duwayne on Feb 19, 2021 18:56:34 GMT
Unlike thalidomide which was taking a medicine while pregnant, the mRNA vaccination will have raised the adaptive immune system sensitivity to anything looking like the SARS-CoV-2 spike protein - that includes the cells on the placenta that embed into the woman's womb. Bill Gates and others in the Green New Deal community would see this as the ideal Malthusian vaccination. I suggest you read more on this and you will find the "spikes" are not similar. If they were, the placentas already would be destroyed by the natural antibodies in healthy young females which are the same as the antibodies stimulated by the mRNA vaccine to help us older folk fight off COVID. |
|
|
|
Post by duwayne on Feb 16, 2021 18:56:09 GMT
Missouri, are you seeing anything in the ENSO comparisons that might be a consequence of the reduced 24/25 solar cycle? The pre-cycle Nino has been progressively smaller from SC23 to SC24 to SC25. The following Nina for SC24 was on average, shorter and warmer than the Nina for SC23. The SC25 Nina so far appears slightly warmer than SC24, but is following the same general trend. Hard to tell at the moment, as our sample is only three. 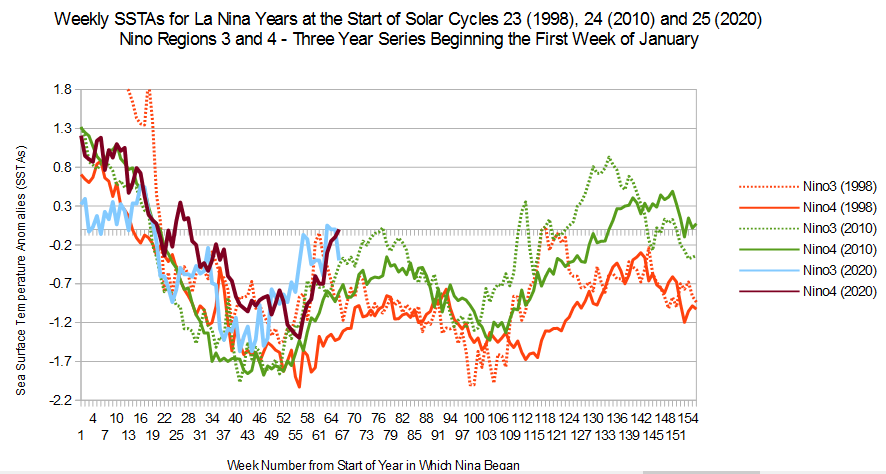 What follows is not a prediction. Missouri, in early 2020, based on the history of ENSO and the solar cycle, a La Nina seemed like a good possibility in 2020 or 2021. I wasn’t totally convinced it would happen in 2020 because the strong El Nino which had preceded the La Ninas in 2010 and 1998 was missing. I thought 2021 might be the better possibility. As it turned out your prediction was correct and there was/is a strong La Nina which began in 2020. So far it has been weaker than its 2 predecessors and there’s not much indication that the weaker solar cycles are driving a stronger La Nina. But, there’s possibly more to come. The 2 predecessors showed a second La Nina downturn leg albeit weaker than the first. Is it possible the “big one” could happen in 2020/2021? Does it require a weakening in the La Nina in the next several weeks to build up a “sling shot” approach to a super La Nina? This is not a prediction. |
|
|
|
Post by duwayne on Feb 15, 2021 21:53:51 GMT
My model is full of guesses and estimates but I think it’s working well enough to show herd immunity will be reached by May. There are 28.3 million reported COVID cases so far. I think we may top out at 30 million. We are 94% of the way there in terms of number of cases.
But what’s pretty amazing is, the number of cases is dropping so fast that if my model is right we could be 99% of the way to the final total number of cases just 4 weeks from now, in mid-March. Cases will be down 85% from the high and falling rapidly.
The question that’s just ahead is how much can we open things up as herd immunity is reached? There are still going to be a lot of people who are not immune. But there will be very few who are contagious with the virus. Given time there will be more who get immunized. In the meantime?
|
|
|
|
Post by duwayne on Feb 15, 2021 18:07:06 GMT
Missouri, are you seeing anything in the ENSO comparisons that might be a consequence of the reduced 24/25 solar cycle?
|
|
|
|
Post by duwayne on Feb 13, 2021 0:43:37 GMT
Vit D3, Zinc, Quercetin, Ivermectin, HCQ, etc. I like it. |
|
|
|
Post by duwayne on Feb 12, 2021 17:28:33 GMT
This whole focus on vaccines is going to fail in a way that the ruling class have not absorbed as yet. The Economist is now discussing the problems with vaccine and the transition to an endemic disease that mutates but is with us for ever. Obviously they need a new approach, I suggest "immunity". Nonentropic, what is the "immunity" approach? |
|
|
|
Post by duwayne on Feb 11, 2021 17:02:32 GMT
The discussion here reminds me that weather is a lot about what you are used to. I grew up in rural western Pennsylvania. When it snowed, you had to drive faster or you couldn't make it up the hills. A few inches of snow with snow tires didn't mean much. When I moved to another state I couldn't believe it when a dusting of snow brought traffic to a complete halt.
People down here in southern Arizona stay home if there is a chance of a light rain.
There is a period in the summer when light rains and lightning are common. They call it the monsoon season.
|
|
|
|
Post by duwayne on Feb 10, 2021 20:32:49 GMT
Gooney Bird anniversary flight: Does anyone else remember the air sickness bags? Or worse yet, running out of air sickness bags. |
|
|
|
Post by duwayne on Feb 10, 2021 3:15:52 GMT
For what it's worth, I’ve put together a model to “guess” what will transpire with respect to COVID cases and deaths in the US over the next few months. Caution… this could be way off because everything is an unknown. I haven’t seen any other projections. Never-the-less, here’s what I’m seeing. Mid-JanuaryA total of 25 Million vaccinations. We’ll just be starting to see benefits of the vaccinations in the total numbers. Because of the Christmas and New Years holidays, any benefits will be largely offset. Mid-February60 million vaccinations in total. New cases per day will be cut in half and the deaths per day will also be halved soon after. Mid-March125 million vaccinations New cases per day cut by 85%. Mid-AprilClosing in on 200 million vaccinations. New cases and deaths down by 98%. Based on this scenario, there will still be 100 million vulnerable people at the end of April who have not been vaccinated and have not had COVID. Yet, new COVID cases could be very, very low. You have to understand the importance of Spread Rate or R zero to see why this is the case. The worldometer US 7-Day average new COVID cases today was 108,000 which is less than half of the 220,000 number on December 22. This is in line with the projection above. It still looks like the new cases could be down 98% by mid-April. The deaths have begun to decline and they should now fall rapidly as the number of cases fall and the vaccinations are focused on the most vulnerable. |
|
|
|
Post by duwayne on Feb 9, 2021 23:31:44 GMT
Neilhamp, it's certainly possible. When the weather forecasters don't even mention tenths of a degree and are often wrong by several degrees, it's not hard to imagine my prediction being off by 0.1C sometime after 15 years. So far, to me, cycle 25 is looking like cycle 24. If you or anyone here sees convincing evidence that solar cycle 25 will push world temperatures down significantly in the next 10 years, make sure to post it. We have no modern instrumentation of what multiple low solar cycles will likely accomplish. My logic is as follows. Global temperatures follow ENSO. ENSO events show cumulative positive magnitude (over decades) over multiple high cycles and cumulative negative magnitudes across low cycles. I speculate that this is due to cumulative solar inputs to the tropical oceans. I further speculate that the fall in tropical ocean temperatures observed across cycle 20 should be more pronounced across two low solar cycles. As the tropical oceans go, so go global temperatures. The hot tub is cooling. One of the provisos of my 0.1C average UAH anomaly prediction for 2007-2037 was if there is no “dimming of the sun”. That was an intentionally non-specific term since I didn’t know what to expect from all the talk of lower Solar cycles. So far, there’s not been much evidence of dimming apart from a lower level of sunspots. The ocean cooling cycle is offsetting greenhouse warming as it should in my opinion, but there is no net cooling. The ONI’s for Cycles 23 and 24 were pretty similar. So far Cycle 25 is looking similar. The UAH anomaly for Cycle 24 was 0.1C, right on my long term prediction. The Hadcrut sea surface temperature anomaly has actually climbed by 0.2C since 2007. I'm expecting some lower UAH anomalies in the next few months and we'll maybe see some effects of "dimming". |
|
|
|
Post by duwayne on Feb 8, 2021 19:46:08 GMT
Duwayne, Your Maxcon 1.0 model seems to take account of AMO and CO2 You don't seem to include any reference to the sun. Do you think the possible reduced solar cycle25 (2020-32), combined with a falling AMO, may result in lower temperatures than your model predicts through to 2037? Neilhamp, it's certainly possible. When the weather forecasters don't even mention tenths of a degree and are often wrong by several degrees, it's not hard to imagine my prediction being off by 0.1C sometime after 15 years. So far, to me, cycle 25 is looking like cycle 24. If you or anyone here sees convincing evidence that solar cycle 25 will push world temperatures down significantly in the next 10 years, make sure to post it. |
|
|
|
Post by duwayne on Feb 7, 2021 17:45:21 GMT
My Maxcon 1.0 Model is explained on this thread and I am using it to predict the UAH6 average anomaly for the 30-year 2007-2037 cool ocean cycle period. The prediction was temperatures would remain flat at 0.2C. 0.2C was the 2007 trended temperature for the 1977-2007 warming period - the 30-year warm ocean cycle.
Roy Spencer has announced a change in the base period for the UAH6 calculations from 1981-2010 to 1991-2020. This means all historical and future UAH6 anomalies will be (rounded to the first decimal point) 0.1C lower than they were and will be. To remain comparable, my 0.2C prediction is now 0.1C average for the 2007-2037 cool ocean cycle period.
On the updated basis, the actual average UAH6 anomaly for the 14-year 2007-2020 period is 0.1C, as predicted. The December 2020 anomaly was also 0.1C.
After 14 years, so far so good. The prediction was based on atmospheric CO2 growing at the rate it grew prior to 2007. The rate has been somewhat faster over the last 14 years despite the talk. We'll see what happens in the future, but a continuation of current growth rates could push the average temperature up by 0.1C.
|
|
|
|
Post by duwayne on Feb 5, 2021 22:31:53 GMT
UAH regional lower troposphere temperature anomalies are in. The tropics dropped to -0.08 C compared to global of 0.12 C (0.20 C spread). The tropics are now the lowest since prior to the 2015 Nino. Global anomalies lag the tropics by 0.2 C. ENSO-Sunspots and UAH Temperature anomalies updated to January, 2020 are shown below. Next stop shooting for 2010 tropic levels of -0.50 C. Still a ways to go, but the tropics index has fallen by -0.67 C since August. Tally ho!  Missouri, you probably know, but the January readings have a different base year (1991-2020, I believe vs 1981-2010, which reduces the anomalies by a little over 0.1C. The anomalies from last year and prior are supposed to be updated in a few days. It's good to see the numbers coming down. |
|


