|
|
Post by throttleup on Feb 17, 2016 1:56:20 GMT
Out of the 205 months since the start of 98' PDO has shown positive months 97 times. Of those 7 were 2.0 or greater as opposed to 5 instances of PDO negative months of 2.0 or more........ some PDO negative ( when compared to other phases in the record). Since the early 80's folk have been logging AGW impacts on the PDO as general ocean warming makes negative PDO values less cold and increased neutral/positive values..... It will be an entertainment to behold as the next 5 years roll out to the tune called above!!!
Graywolf's post above reminds me of something I see often. The basic thought being a positive PDO is indicative of "warmer temperatures" and vice versa (a la AMO). However, unlike the AMO which is a temperature-based index, isn't the PDO an index of the spatial distribution of north Pacific SSTs?
So, I don't get all the "excitement" in various quarters (one way or the other) regarding the PDO index.
But I could be a dope. It's entirely possible. Likely even.
If someone can illuminate me... thank you in advance.
|
|
|
|
Post by throttleup on Feb 10, 2016 1:48:28 GMT
Several years ago as the 30-year Ocean Current warm phase was ending, I predicted that the ENSO-driven record satellite-based temperatures of 1998 would not be exceeded for the duration of the 2007-2037 cool Ocean Current phase if the growth in atmospheric CO2 continued at the then current rate. The 10-year average CO2 growth rate has increased from 0.43% per year to 0.54% per year. Despite that, the RSS yearly anomaly for 1998 of 0.55C has so far not been exceeded with the highest yearly reading since 1998 being 0.47C in 2010. 2015 was 0.36. The UAH anomaly was 0.48 for 1998, 0.34 in 2010 and 0.27 for 2015. 2016 could test the 1998 highs. Through January the satellite anomalies are running about 0.1C above the 1998 year record. February could even be a little warmer. We’ll see what happens. Will I have to adjust for the faster CO2 growth? Duwayne, Have you factored in the resulting increase in Graywolf posts?  (I love ya, Graywolf! Cheers!) |
|
|
|
Post by throttleup on Feb 9, 2016 23:39:53 GMT
I'm thinking that nino will fade to neutral only ( no Nina) as Northern summer skews global temps ( now the IPO is back into surface heating phase?). This month saw us rise above 405ppm CO2, levels this high were last seen in the Miocene ( 15 to 33 million years ago ) starting at the time Antarctica first held ice fields ( 33 million years ago) so we enter into global condition that edge toward an ice free planet ( in time and should CO2 remain elevated) As with the Perma Frost the frozen lands ( Greenland/Antarctica) also hold part of the old carbon cycle , entombed when the ice arrived, awaiting re animation. last year saw CO2 rise by 5ppm, rather higher than the 2ppm we expected, this could be solely down to warmer oceans not able to absorb as much CO2 or may reflect the 4th " 1 in 100 year" drought to strike the Amazonian Forest since 2000? Whatever the cause to see CO2 levels accelerate when the world tries to slow gains must be of concern? ( to anyone knowing what CO2 does to global temps?)
I'm no expert, but I believe the Late Ordovician Period was also an Ice Age while at the same time CO2 concentrations were roughly 10 times higher than today.
|
|
|
|
mellow
Oct 9, 2015 21:23:15 GMT
Post by throttleup on Oct 9, 2015 21:23:15 GMT
Flearider,
Completely understand.
Woof!
|
|
|
|
Post by throttleup on Sept 7, 2015 3:33:56 GMT
How fast does CO2 normally get into the atmosphere compared to our recent additions Siggy? Does that speed of introduction matter at all ? My concerns revolve around such timings? We know , after the dust settles ( i.e. enough time has elapsed for all impacts to manifest?) but not as things are ongoing? Here the past might have no lessons for us? We need look for times when GHG forcings increased at a similar rate to today's rises and see how global temps reacted ( and how 'universally'?) back then? Take a stream. You have a billion gallons of water to add to it. The first time you introduce a slow steady flow 'till the tank is empty. What impacts would you expect to the stream ( its banks , base and the life in/around it?). Next Dump the whole tank in the stream ,all at once...... The results of both 'events' would show us what happens when you add that water to the stream but the two results , though both 'fact', will differ vastly? I do not think that things just act like you've pushed the fast forward button on the V.T. ? Change the rate of introduction ( temp rise or GHG rises) and you surely alter the results? Graywolf, I understand your need to see CO2 as the root of all evil. However, if true...  www.climate4you.com/images/HadCRUT4%2050yr%20AnnualTrendSinceDecember1899.gif www.climate4you.com/images/HadCRUT4%2050yr%20AnnualTrendSinceDecember1899.gifDid CO2 go down from the early 1950s to the mid-1980s? How does one explain the two parallel warming periods from 1915 to 1950 and the 1980s to the early 21st century? |
|
|
|
Post by throttleup on Aug 31, 2015 14:04:40 GMT
The Arctic melt ponds... have evaporated.Must be the heat.  |
|
|
|
Post by throttleup on Aug 25, 2015 18:16:56 GMT
Nice crepuscular rays at 86 deg N. Temp: -4.1C Melt ponds have a nice coating of... something. |
|
|
|
Post by throttleup on Aug 20, 2015 22:05:46 GMT
The Arctic pools at 86 deg N are beginning to re-freeze... |
|
|
|
Post by throttleup on Aug 19, 2015 0:07:28 GMT
A couple of days away from sailing past the 2013 min and not far then to pass 2014 and then 2009 I guess we can just bend over and kiss our ice goodbye! |
|
|
|
Post by throttleup on Aug 15, 2015 21:13:24 GMT
There is an 'earth' icon bottom left, click and all will be revealed. ...There are 100 options! On pc, mouse left click hold changes orientation. ..roll centre scroll to zoom On tablet/phone simple to orientate but my s5 hates to zoom. ... Anyone how frequents this site, try clicking on wind speeds at different altitudes...start at surface and work way up.....mind blowing! !! (Pun not intended but noticed  ) acidohm, you're a friggin' genius! I feel like such a dope! But, that's OK -- I learned something! Thanks!! |
|
|
|
Post by throttleup on Aug 15, 2015 21:00:34 GMT
Increased cooler waters appearing in east .....is this a sign the heat is being lost?? Also the cooler 'blob' in the west is appearing over the horizon. acidohm, I can NOT for the life of me figure out how to get the different, specific "projections" with nullschool. There are the 'canned' projections, but if I want a specific view of the planet, how is that done? Can you share any tips, tricks, info or source that might help? Thanks! |
|
|
|
Post by throttleup on Aug 15, 2015 16:21:55 GMT
|
|
|
|
Post by throttleup on Aug 12, 2015 22:28:54 GMT
Duwayne, I see you're still earning that gold star. :-) Maybe I missed something you mentioned earlier, but when you use the term "cool ocean current phase" what exactly are you including in that term? ENSO? AMO? PDO? A combination thereof? Something else altogether? Thanks! Throttleup, thanks. There's a 60-year cycle in global temperatures and as I've shown in past posts it correlates well with the AMO and PDO. And ENSO is mostly positive during the warm part of the cycle and mostly negative duing the cool part. So all 3 seem to be contributing. In addition some of the other ocean currents seem to fit into the pattern but their relationship is not as distinct. Duwayne, Thanks! I'm not as well-versed on this as others so bear with me. Granted, we are on the cusp of what appears to be a significant el Nino (although others have commented it has odd things about it). We'll have to watch to see where that goes. But the AMO is "past its peak," is it not? I guess one question is, does AMO = PDO = ENSO? That is, do they all contribute to global temps equally? I would guess PDO/ENSO would have a greater effect simply due to being in the large Pacific. But the PDO is really just a spatial distribution of temps, isn't it? So, my brain wants to think there's a net zero contribution from the PDO. Yes, the el Nino/la Niñas bunch together cyclically, but individual events are not all that long-lasting. But the AMO cycle is of a longer duration before it switches phases -- so I guess I tend to think that it will have a noticeable effect as it slides deeper into its cool phase. All non-distinct notes, duwayne! Sorry about that. Comment as you can or see fit. Your posts are always of interest. (along with everyone else's!). |
|
|
|
Post by throttleup on Aug 11, 2015 22:23:29 GMT
The Hadcrut4 June anomalies are finally available, so here’s the quarterly update of my 2007 global warming forecast covering the average values from 2007 to mid-2015. 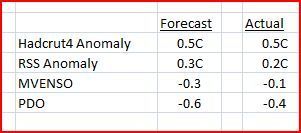 Global warming is as predicted for the Hadcrut4 anomaly and the RSS satellite-based anomaly is 0.1C cooler than predicted. Over the past 6 months both MVENSO and PDO have been quite warm and as a result, each is about 0.2 above my prediction. Global temperatures have been flat for several years and a cool Ocean Current phase is the logical explanation. But the recent warm MVENSO and PDO raises the possibility that the cool phase is ending short of the 30-year term which history has shown we should expect. At this point there’s not enough understanding of the Ocean Current mechanisms to prove it one way or the other. We’ll just have to wait and see what happens over the next 2 or 3 years and beyond. One key thing to watch is whether the RSS anomalies begin to turn up sharply in response to a possible long term change in the Ocean Currents and remain high 3 or 4 months after the current El Nino conditions end. Duwayne, I see you're still earning that gold star. :-) Maybe I missed something you mentioned earlier, but when you use the term "cool ocean current phase" what exactly are you including in that term? ENSO? AMO? PDO? A combination thereof? Something else altogether? Thanks! |
|
|
|
Post by throttleup on Jul 27, 2015 23:26:15 GMT
Sorry. Just checking to see if there was any ice up North. Carry on... |
|


 )
)