|
|
Post by hrizzo on Mar 18, 2021 13:11:05 GMT
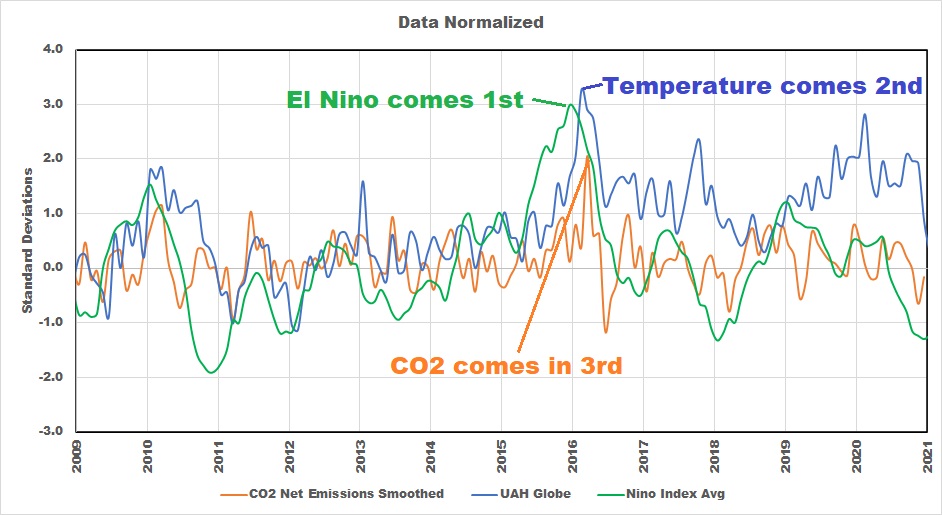 So CO2 is a RESULT of increase in Pacific SST and it is very peaky (not what you would expect with the claims for lifetime in atmosphere) nautonnier, that graph comes from an article or a paper? If so, could we have a link? |
|
|
|
Post by hrizzo on Jan 9, 2021 15:55:06 GMT
|
|
|
|
Post by hrizzo on Jan 9, 2021 15:45:12 GMT
David Viner, a renowned CRU climatologist, wisely predicted in 2000: "Children will not know what snow is." I remember it right now, looking through a window of my flat in Zaragoza, Spain:  |
|
|
|
Post by hrizzo on Dec 25, 2020 12:36:49 GMT
Taking into account the Infection Fatality Rate of Covid and flu, can we start calling this plandemia "the Chinese flu"?  |
|
|
|
Post by hrizzo on Sept 19, 2020 17:48:38 GMT
I suffered the chinese virus in middle February, here in Zaragoza, when nobody talked about the illness in Spain.
A little fever, a little cough, sorethroath, headache, and extreme pain in my armas, specially at night, all of which I confronted with an aspirine before going to bed. And a short fainting, a few seconds, while taking my daily morning walk.
With my elder person usual sufferings, specially my weak heart, it was not very strange.
Fortunately, at that early stages of the pandemic, my doctors examined me and found no problems, so I returned home.
I learned that I had had the virus a month later, when numerous brown spots appeared in my arms, first in the left and then also in the right one. They lasted about six weeks, and then dissapeared (but I still have a few pale marks).
Now I think that if I had been locked down in a hospital, I would not be here writing this.
I was very lucky.
|
|
|
|
Post by hrizzo on Sept 1, 2020 16:22:06 GMT
Well, climate is horrible in many places around the world, and old popular sayings make clear that (even centuries ago, proving that AGW is just like thiotimoline and affects the past).
Since at least the times of the Romans, when it was named CaesarAugusta, everybody knows that Zaragoza enjoys nine months of winter and three months of inferno (in Spanish it rimes: "Nueve meses de invierno, tres meses de infierno").
|
|
|
|
Post by hrizzo on Mar 5, 2020 9:26:44 GMT
Thank you, Ratty and missouriboy. I am always here (although my health diminishes as my age grows); it is just that I read and listen a lot, specially to people that know much more than I. I am very active in Twitter and GAB, nevertheless. Times change, climate changes, but as the Good Doctor used to say, the fight is always the same. ![]()  |
|
|
|
Post by hrizzo on Mar 4, 2020 7:48:33 GMT
missouriboy
Greta´s acolytes, when confronted with reality, always ask the same question just to digress: "where did you get the data?
So,it would be great to have in the image the source of data... and leave to them the task to study it and debate properly or just shut up.
|
|
|
|
Post by hrizzo on Aug 22, 2019 16:32:07 GMT
Thank you, blustnmtn:
Your link tweeted here:
|
|
|
|
Post by hrizzo on Jul 10, 2018 10:35:34 GMT
A lunatic tax, of course  |
|
|
|
Post by hrizzo on Mar 23, 2018 8:16:59 GMT
 11th May 
|
|
|
|
Post by hrizzo on Jan 27, 2018 14:03:03 GMT
Impact of Climate Change on Human Evolution: The Odyssey from AfricaPaleoclimatology, the study of climate in the past all the way back to deep time, is one of the pillars of climate science. It shows us the wide range of climates that have existed on earth, from near-global glaciation in “snowball-earth” epochs to hothouses where the poles were forested. It puts in a correct perspective discussion about climate change – dismissing any notion that climate has ever done anything other than endlessly change.
|
|
|
|
Post by hrizzo on Jan 20, 2018 7:43:24 GMT
Climate and Civilization for the past 4,000 yearsThe Holocene Thermal Optimum ended at different times in different parts of the world, but it had ended everywhere by 4,000 BP (BP here means the number of years before 2000) and the world began to cool. The timeline shown in Figure 1 shows the GISP2 Central Greenland ice core temperature proxies in blue and the HadCRUT 4.4 surface temperature estimates for the same area in red.
|
|
|
|
Post by hrizzo on Dec 16, 2017 11:47:52 GMT
The "climate models" are just another version of those "crazy trucks" or "knives on the loose" of leftish multicultural "news". Never a driver, never a stabber... just inanimate objects doing bad things. Modelers are ethereal. |
|
|
|
Post by hrizzo on Dec 3, 2017 10:37:46 GMT
Nature Unbound VI – Centennial to millennial solar cycles judithcurry.com/2017/12/02/nature-unbound-vi-centennial-to-millennial-solar-cycles/Holocene climate has been affected in different periods by several centennial to millennial solar cycles. The ~ 1000-year Eddy solar cycle seems to have dominated Holocene climate variability between 11,500-4,000 years BP, and in the last two millennia, where it defines the Roman, Medieval, and Modern warm periods. The ~ 208-year de Vries solar cycle displays strong modulation by the ~ 2400-year Bray solar cycle, both in its cosmogenic isotope signature and in its climatic effects. The Centennial, and Pentadecadal solar cycles are observable in the last 400-year sunspot record, and they are responsible for the present extended solar minimum that started in 2008.… Conclusions:1) The ~ 1000-year Eddy solar cycle seems to have dominated Holocene climate variability between 11,500-4,000 years BP and in the last two millennia, where it defines the Roman, Medieval, and Modern warm periods. 2) The ~ 208-year de Vries solar cycle displays strong modulation by the ~ 2400-year Bray solar cycle, both in its cosmogenic isotope signature and in its climatic effects. 3) The ~ 88-year Gleissberg solar cycle is ill-defined in the literature and hasn’t manifested itself for the past 3,500 years. 4) Besides the ~ 11-year Schwabe solar cycle, the Centennial (Feynman), and Pentadecadal solar cycles are observable in the sunspot record. The ~ 100-year Feynman solar cycle is responsible for the present extended solar minimum. 5) In all cases a decadal or longer decrease in solar activity is associated with a decrease in temperatures and a change in precipitation patterns. A 10-year delay between solar changes and climatic changes is observed in some studies. |
|


