|
|
Post by SDJ on Mar 3, 2010 3:45:17 GMT
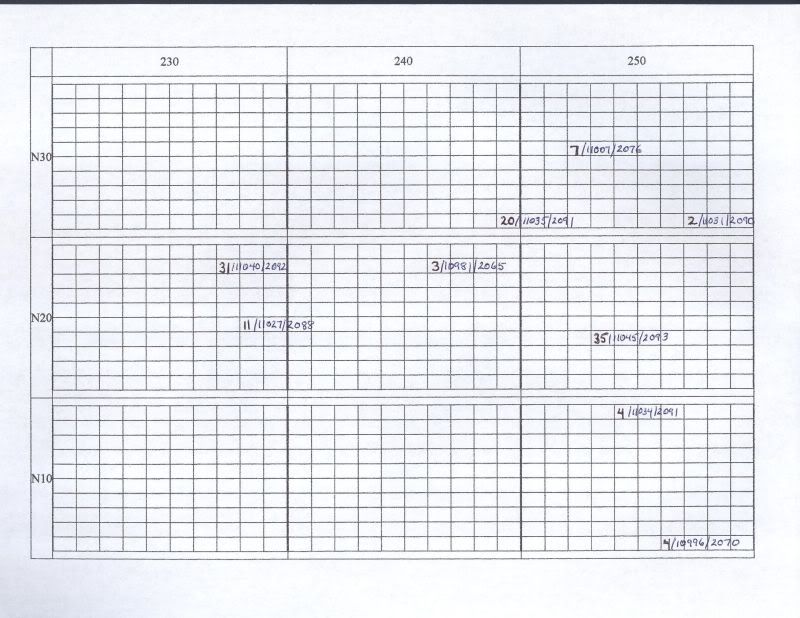
OK, I've finished plotting the entire series since 1996, and have started to scan the raw pages. When I get that done, I'll make them available to anyone who's interested. Here's the Generation 3 level I'm moving into next. This is a plot of the active regions since the beginning of Cycle 24, in the format of Sunspot Count/Active Region Number/Carrington Rotation for the northern hemisphere activity that's rolling toward us:  I found a couple of mistakes I'd made on the earlier, larger-scale plots I did and corrected them here, although they were small levels of activity and shouldn't have that much of an effect on things overall. What's shown on this image is that there is recurrent activity in the region of AR 10981, the "first sunspots of Solar Cycle 24" from mid-January, 2008, but it's taken several rotations to reappear in any significant sense. The regions obviously are not dots like I've drawn them, they're larger areas that I've plotted with dots approximating their centers by averaging the data from the source I listed at the top of the page. They seem to have been split into 2 regions on CR 2091, appeared to be one larger region a bit to the east in 2092, and then flipped a few degrees west during 2093. Looking onward, there's not a lot of activity coming just after this, although there may be some at a lower level, but there was a fairly large region (AR 11046, spot count = 33) on the last rotation that should be coming around the bend in the same part of the northern hemisphere in about 3-4 days. Not much to be expected in the southern hemisphere this go-round, notwithstanding something entirely new and unexpected appearing. |
|
grian
Level 2 Rank
 
Posts: 50
|
Post by grian on Mar 3, 2010 9:28:51 GMT
The people who compiled the data considered it important enough to note the position by latitude, longitude and Carrington longitude on a daily basis for each active group. So? That's a complete non sequitur, bears no relation to the discussion. You are saying there are solar longitudes where there is limited activity and you're basing that on sunspot groups as points. But they're not, they're areas and if you plotted those I suspect that your "non active" regions would disappear. This is science. You have presented some data and an interpretation of it. I have raised some, I believe, valid objections. So show me some data that refutes my objections. I don't doubt you've put a lot of hard work into this, but if you put something like this up on the board, then expect to have it critiqued - fairly I hope. |
|
|
|
Post by SDJ on Mar 3, 2010 11:22:12 GMT
The area of activity coming into view in the northern hemisphere is expected to have a level of 35 or more spots.
There will be another one of slighly less intensity 3-4 days from now at approximately the same latitude.
There won't be any significant activity in the southern hemisphere for at least a couple of weeks.
Your turn.
|
|
clive
Level 2 Rank
 
Posts: 50
|
Post by clive on Mar 3, 2010 12:13:19 GMT
Keep up the good work SDJ, the longitude value of the first SC24 group looks to agree with the most powerful recurring region of SC24. It may be coincidence, but time will tell. Remember the Carrington longitude is not precise, rotation differences muddy the waters to some degree.
I for one will be interested in your spreadsheet.
|
|
|
|
Post by SDJ on Mar 3, 2010 13:19:15 GMT
Thanks, Clive. I know the regions get "stretched" over time by the unevenness of the rotation. I was just relying on the original data to derive the ballpark figures: AR Lat. Long CarrLo Area Type Len SSN Hale Magnetism
10981 N30 E22 246 20 Cso 3 3 Beta
10981 N29 E14 241 20 Bxo 1 2 Beta
10981 N27 W04 246 20 Axx 2 2 Alpha
**********************************
11035 N31 E07 250 20 Bxo 3 4 Beta
11035 N30 W05 248 120 Dai 8 16 Beta
11035 N30 W18 248 140 Eac 11 20 Beta-Delta
11035 N30 W32 249 210 Eac 12 14 Beta
11035 N30 W45 249 310 Esi 13 10 Beta
11035 N30 W56 247 220 Eho 12 8 Beta
11035 N31 W70 248 310 Eho 13 4 Beta
11035 N31 W85 249 90 Fso 18 2 Beta
**********************************
11040 N28 E59 241 80 Bxo 5 5 Beta
11040 N29 E47 240 40 Bxo 3 4 Beta
11040 N30 E35 239 70 Cri 10 10 Beta
11040 N30 E18 243 130 Eao 15 15 Beta
11040 N29 E10 237 300 Dhc 9 25 Beta
11040 N28 W04 238 300 Eao 12 25 Beta
11040 N28 W11 236 380 Eki 13 31 Beta
11040 N28 W30 238 290 Eki 13 24 Beta
11040 N29 W41 236 350 Eki 13 16 Beta
11040 N29 W57 239 290 Cki 12 14 Beta
11040 N30 W74 242 160 Dso 8 6 Beta
11040 N26 W83 238 140 Dho 5 4 Beta
**********************************
11045 N24 E15 250 290 Dkc 8 9 Beta-Gamma
11045 N23 W01 253 320 Fkc 19 18 Beta-Gamma
11045 N23 W17 256 420 Fkc 20 35 Beta-Gamma-Delta
11045 N23 W26 252 300 Fkc 19 25 Beta-Gamma-Delta
11045 N22 W39 252 240 Fai 17 16 Beta
11045 N22 W52 252 150 Fsi 17 11 Beta
11045 N19 W63 251 90 Fso 22 5 Beta-Gamma
|
Sorry, the columns won't line up properly, but the headings will match up if you read from left to right. "Type" is the McIntosh classification. I haven't started digging into those or the Hale Magnetism classification yet, either. You can see each of the subsequent ARs that appeared sort of "circling" around the forerunner, 10981, as my plot above shows. If the locations had loggings near the centerline, I used those since there seems to be a parallax effect moving away from it. Almost all of the lengths in degrees also fall within the 30x30 scheme I used for the plot, too, |
|
|
|
Post by SDJ on Mar 3, 2010 15:43:50 GMT
"So? That's a complete non sequitur, bears no relation to the discussion. You are saying there are solar longitudes where there is limited activity and you're basing that on sunspot groups as points.
But they're not, they're areas and if you plotted those I suspect that your "non active" regions would disappear.
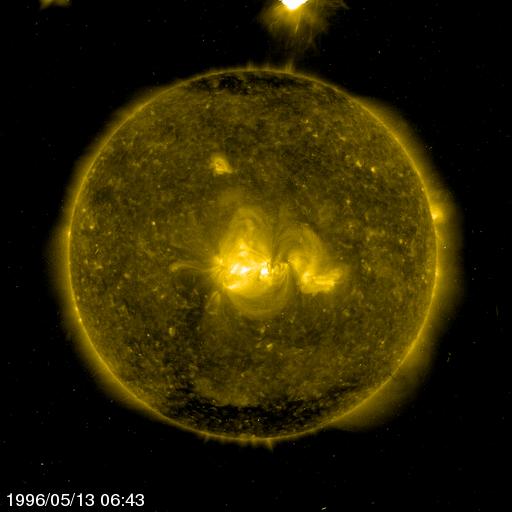
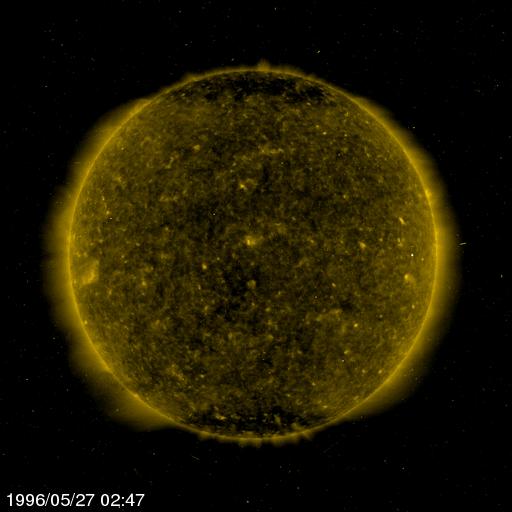
This is science. You have presented some data and an interpretation of it. I have raised some, I believe, valid objections. So show me some data that refutes my objections."I first became interested in this issue after reviewing several hundred thousand images of the Sun. I noticed that as SC 23 began, there seemed to be areas of the sphere that had more activity than others. Here, for example, is AR 7962 on May 13, 1996:  The data from the source I'm using was as follows (same headers as above): 19960513 7962 S07W01 259 0110 CSO 07 013 Beta Which could be used to derive a centerpoint for the region on that day. This information must be of some importance, since they decided to record it. Here's the Sun 14 days later:  I know it may be presumptuous of me to say I suspect there's a difference in activity levels in the two images. "Smearing" the active area from 2 weeks earlier on the other side of the sphere could make the inactivity shown in the second image "disappear", I guess, but I'm skeptical.
|
|
|
|
Post by waynelim on Mar 3, 2010 18:46:32 GMT
"So? That's a complete non sequitur, bears no relation to the discussion. You are saying there are solar longitudes where there is limited activity and you're basing that on sunspot groups as points.
But they're not, they're areas and if you plotted those I suspect that your "non active" regions would disappear.
This is science. You have presented some data and an interpretation of it. I have raised some, I believe, valid objections. So show me some data that refutes my objections."I first became interested in this issue after reviewing several hundred thousand images of the Sun. I noticed that as SC 23 began, there seemed to be areas of the sphere that had more activity than others. Here, for example, is AR 7962 on May 13, 1996:  The data from the source I'm using was as follows (same headers as above): 19960513 7962 S07W01 259 0110 CSO 07 013 Beta Which could be used to derive a centerpoint for the region on that day. This information must be of some importance, since they decided to record it. Here's the Sun 14 days later:  I know it may be presumptuous of me to say I suspect there's a difference in activity levels in the two images. "Smearing" the active area from 2 weeks earlier on the other side of the sphere could make the inactivity shown in the second image "disappear", I guess, but I'm skeptical. Before asking other questions about why you conclude what you do and what you believe are the scientific reasons (causality), are you taking into account the differential rotation of the sun's surface, that being about 25 days at the equator and about 35 or 36 days at the poles? What does that do to your chart? |
|
|
|
Post by SDJ on Mar 3, 2010 18:54:19 GMT
I'm just using the data entries from the source I cited in the beginning, not any personal observations I've made myself. I know there's differential rotation from the equator to the poles and that active regions get stretched by it. My goal was merely to see if there were any regularities in activity levels on a larger scale, although plotting the derived centerpoints of active regions based on the data does seem to be causing some problems. I plan to use larger dots in the future.  |
|
|
|
Post by waynelim on Mar 3, 2010 23:24:52 GMT
I'm just using the data entries from the source I cited in the beginning, not any personal observations I've made myself. I know there's differential rotation from the equator to the poles and that active regions get stretched by it. My goal was merely to see if there were any regularities in activity levels on a larger scale, although plotting the derived centerpoints of active regions based on the data does seem to be causing some problems. I plan to use larger dots in the future.  The difficulty is, though, that if you have correlation but not causality, then any one instance that doesn't fit a pattern blows the pattern matching out of the water. Without a scientific, physical basis for having plotted it as you have, you don't have a fallback to try and explain why you have an outlier. You just have an outlier that lays waste to pattern matching. A rough analogy would be that you notice a plant grows every day so you plot the height of it, and indeed it does grow every day for a while but then it suddenly dies. You have correlation without causality because the outlier is that the plant died and stopped growing. Whereas someone postulates that water makes the plant grow during times of adequate light, plots the plant growth and sees that on a day without rain, the plant stops growing and subsequent dies. In the first case, you are doing it without postulating why it is happening, only that it does, and so anything unexpected ruins the pattern matching. In the second case, you have a physical hypothesis as to why it is happening, and plotting either confirms or denies it, but at least if it does deny it, you have some basis for figuring out why. |
|
|
|
Post by SDJ on Mar 4, 2010 0:41:55 GMT
OK, I realize that I have failed to meet various strict standards for scientific rigor. That was not my intention at the outset. I believe if you look at what I've said, "might", "approximately", "seems to" and other non-scientific terminology predominates.
I found a reliable dataset that I thought might offer some insights into solar activity. I got it into a workable state and then started looking at what it showed. There appears to be some regularity in the levels of activity in different large areas of the Sun. I did the plots to get a visual aid in locating areas of possible interest to guide anything further I might want to do, such as looking for any similarities or differences in the initial phase of SC 23 compared to the initial phase of SC 24. I haven't gotten that far yet, it's only an idea I have. There are 22,900 lines of data, each containing 9 fields. I apologize for not having everything up to snuff for everyone's standards yet.
In the meantime, I've explained what I've done, cited the data source, and offered some initial suggestions about what the data might show, the apparent repetitive periods of activity around the first AR of Cycle 24, for example.
I did all this because of personal interest, not to prove anything to anyone. I spent a lot of time getting things in order so they would enable further investigations, and I've offered to share what I've done with anyone who's interested.
If it causes such consternation among so many people, I can just stop providing information to calm your little hearts.
You can find the link to the dataset in the first post in this thread and go at it yourself.
|
|
|
|
Post by chickenlittle on Mar 4, 2010 16:39:35 GMT
Waynelim, or anyone else: Is there a formula relating the sun's latitude to the rotation time that could be used to adjust the NOAA data to account for the differential rotation?
|
|
|
|
Post by chickenlittle on Mar 4, 2010 17:15:34 GMT
Nevermind.
\omega=A+B\,\sin^2(\varphi)+C\,\sin^4(\varphi)
Angular velocity in degrees per day as a function of solar latitude in degrees. Wikipedia.
|
|
|
|
Post by SDJ on Mar 5, 2010 3:57:47 GMT
Differential rotation might be worth considering, if your concept of active regions is that they are discrete little boats floating on the "surface" of the solar sphere that mysteriously appeared from nowhere. I hold the contradictory view that they might be the result of other processes and are only of importance because we can see them, specifically that they are the result of ongoing processes occurring far beneath the visible surface, things like convection currents going deep in the direction of the core reaction. Sensors have detected the nuclei of fairly heavy elements, containing up to 26 protons in one study from a couple of cycles or so ago regarding the ejecta of major events: www.springerlink.com/content/q185404173p2488x/Now while Pluto's 38th moon with its massive gravitational pull might be able to suck out sunspots and fuse hydrogen nuclei into heavy elements, I remain skeptical. What I hoped to discuss in the beginning, which caused unexpected paroxysms of apoplexy, syncope, dropsy and chilblains among many other maladies for some people, is that there might be things worth taking a more in-depth look into, specifically, for example, the appearance in two subsequent solar rotations of areas of major activity appearing within a few (3) degrees of each other, the second of which produced an X-class flare in SC 23 (AR 9704, November 23, 2001). I would produce a plot of that along with the data, but I do not wish the inevitable carnage of accusations of my lacking "science" that would erupt to be laden onto my soul. Could it possibly be that the source of the activity we see goes far deeper? The best analogy I've come up with so far, having spent a few hours thinking about the question while wandering around doing other things, is this: Think of a stream with clear water you can see through. There's something in the bed of the stream that occasionally emits an air bubble that rises to the surface, whereupon it becomes a discrete little boat that floats downstream with the current. If you go chasing the little boat (differential rotation), it will seem to be distant from its initial location. But if you stand beside the stream and look where the bubbles are coming from (Carrington longitude), you'll discover that the location of the next bubble is not that far from where the first one appeared. I await the next round of deprecations with honor. |
|
grian
Level 2 Rank
 
Posts: 50
|
Post by grian on Mar 5, 2010 21:24:40 GMT
What I hoped to discuss in the beginning, which caused unexpected paroxysms of apoplexy, syncope, dropsy and chilblains among many other maladies for some people, Typical reaction of the pseudo-scientist. You're not worth arguing with because all you will do is react as you have above. Stick to astrology why don't you. |
|
|
|
Post by waynelim on Mar 5, 2010 23:32:15 GMT
|
|


