clive
Level 2 Rank
 
Posts: 50
|
Post by clive on Apr 12, 2010 15:22:17 GMT
The bemusing point surfacing is that the Carrington longitude needs to be adjusted. Why is it so?
|
|
tenuc
New Member

Posts: 10 
|
Post by tenuc on Apr 12, 2010 17:11:27 GMT
Thanks SDJ for an interesting observation and some good charts.
The Excel spreadsheet are just what I'm looking for - PM on the way.
Many thanks for making them available.
|
|
|
|
Post by lsvalgaard on Apr 12, 2010 18:43:48 GMT
The bemusing point surfacing is that the Carrington longitude needs to be adjusted. Why is it so? Because observations show that the places where activity occurs do not stay fixed in the Carrington system [which was derived 150 years ago as an average of the solar rotation as then perceived]. With the hindsight of 150 years more data we know better, but since the Carrington system is just an arbitrary convention we stick with it in order not to introduce some other arbitrary system which will need to be changed another 100 years from now, etc. |
|
clive
Level 2 Rank
 
Posts: 50
|
Post by clive on Apr 13, 2010 4:58:38 GMT
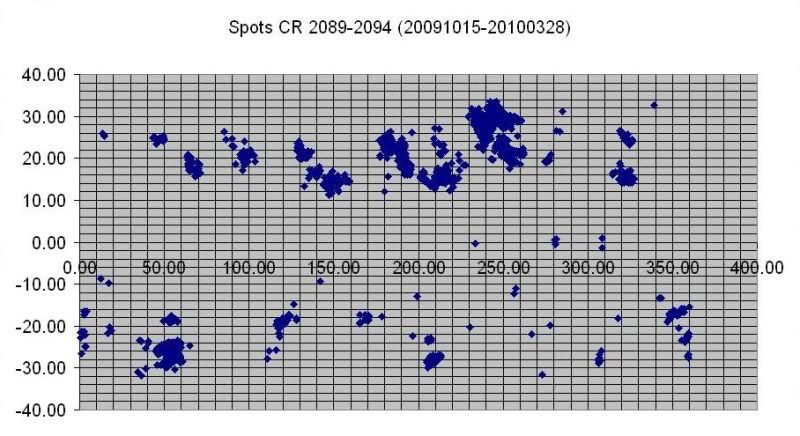
The bemusing point surfacing is that the Carrington longitude needs to be adjusted. Why is it so? Because observations show that the places where activity occurs do not stay fixed in the Carrington system [which was derived 150 years ago as an average of the solar rotation as then perceived]. With the hindsight of 150 years more data we know better, but since the Carrington system is just an arbitrary convention we stick with it in order not to introduce some other arbitrary system which will need to be changed another 100 years from now, etc. The interesting part is the 150 years of new data. Determining the accuracy of the rotation rate still seems elusive. SDJ's charts show both the sunspot drift (torsional oscillation) and the multiple re occurrence of active regions. 2 in particular look precise in their origin occurring at 55 and 320 CL suggesting deep activity not subject to surface flow influence. Rotation changes over longer time spans would be another issue but for short term analysis SDJ's work is useful. |
|
|
|
Post by SDJ on Apr 24, 2010 2:57:45 GMT
I just realized I hadn't posted this plot. This is all Solar Cycle 24 activity since last October, when it looked like things were starting to pick up. From the University of Debrecen, Hungary "spots" data:  I didn't finish it because I went on to work on something else. That's latitude on the vertical axis at the left and Carrington Longitude on the horizontal axis. I haven't updated it for almost a month, too, but it should still show what to expect in the near future. |
|
|
|
Post by SDJ on May 7, 2010 22:06:24 GMT
Things have calmed down for the time being, so I had a few minutes to have a look at another database, the SRS (Solar Region Summary) from the SWPC, available here: www.swpc.noaa.gov/ftpmenu/warehouse.htmlThese are the daily text files that overlap somewhat with the Debrecen University data I discussed previously. Just as a start, I thought I'd have a look at a plot covering the entire period that's available from the end of 1995 as SC 22 was ending through all of SC 23 and into SC24 up to a week or so ago this year. Here are each of the NOAA regions plotted by AR number and latitude. The plot shows the typical "butterfly diagram", albeit somewhat stretched out over time. It looks just like a classic butterfly diagram if the horizontal axis length is shortened.  I've "massaged" the data a bit by manually defining the latitudes and other data fields for each AR from the individual daily listings, which took some time to whip into shape since each AR could have up to a maximum 15 daily listings in this dataset. The time series could also be extended further back into the past (January 1992) with data from the images here, although that would take some time since it would have to be done manually: www.solar.ifa.hawaii.edu/ARMaps/Archive/The first thing of interest I noted in the plot is the extended dense cluster of activity in the southern hemisphere as SC 23 was winding down, in stark contrast with the dearth of southern hemisphere activity as SC 24 progresses. |
|
|
|
Post by SDJ on Oct 26, 2010 21:54:03 GMT
Sorry, folks, have been absent for quite a while due to family issues.
Anyone notice any regularities in the locations of recent (i.e., since last May) activity?
|
|
|
|
Post by Maui on Feb 1, 2011 17:53:59 GMT
This idea has been "floating" around here and on a weather forum... But is the information here consistent with the idea that some kind of cloud of water is hitting the south side of the Sun, Earth, Jupiter, and perhaps even Enceladus? I am referring to the Sun-grazing comet in December, and current weather anomalies on Earth.
By the way, it's another beautiful day here in the San Juan Islands. My condolences to any who are getting too much snow. NOAA's prediction of a cool winter up here has been a bust.
|
|