|
|
Post by SDJ on Feb 24, 2010 2:47:19 GMT
Well, folks, after wandering off because of tiring over the dueling graphs proving the role of Pluto's 38th moon in sucking sunspots out of the Sun, I've decided to wander back in. I spent my time in the interim going through data available from here: www.swpc.noaa.gov/ftpmenu/warehouse.htmlwhich has nearly-complete detailed information on a daily basis of sunspot counts, active region numbering and all that. After spending some time doing initial collating of the information available there, I decided to start looking at what I have so far, and started with these: 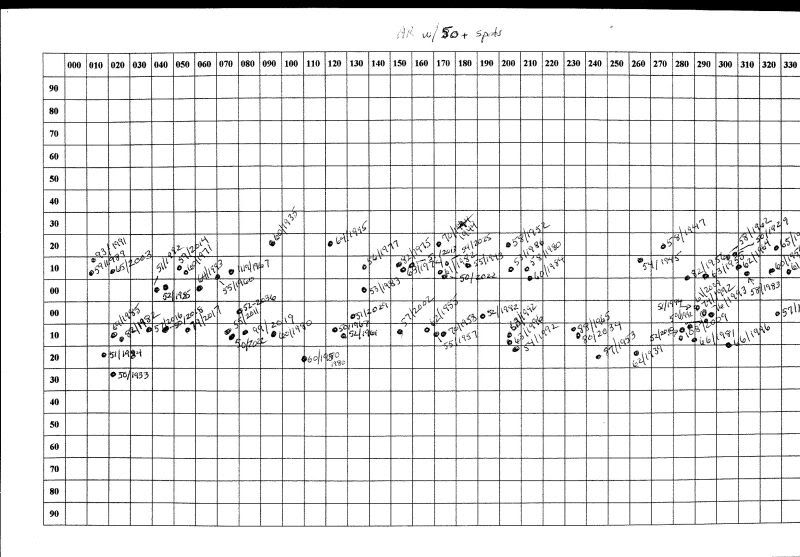 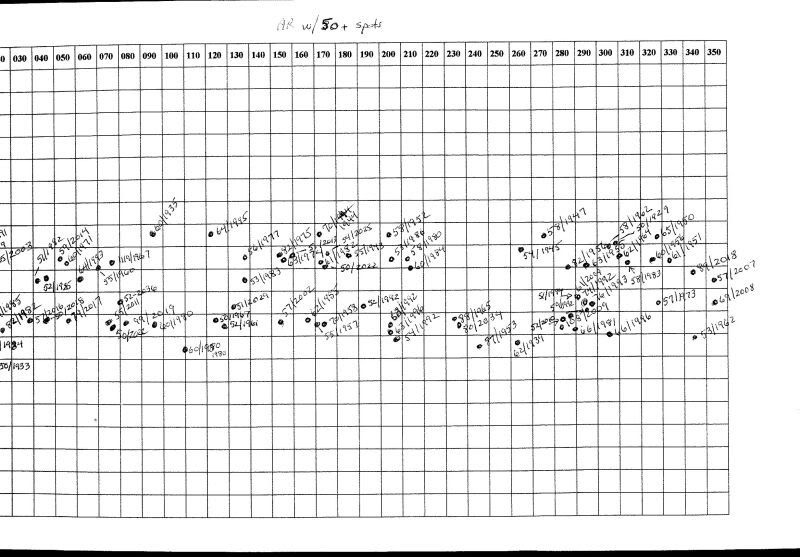 They are very sophisticated plots of all active regions since 1996 logged with sunspot counts greater than 50, located (approximately) by latitude and Carrington longitude. I did the plots with very sophisticated supercomputers, obviously, but used legal paper, so if you download both images and tape them together, you might see something interesting. I'm in the process of digging deeper and in much greater detail, and will have more on that later. |
|
|
|
Post by SDJ on Feb 24, 2010 3:42:31 GMT
Sorry, I should have been clearer...the pencilled entries are in the format of Sunspot Count/Carrington Rotation, so there's a chronological component to the data.
|
|
|
|
Post by andrewuwe on Feb 24, 2010 12:57:47 GMT
Nothing much above or below 30 degrees. It be nice to see a plot of group size against latitude. But I guess you are talking about lopsided longitudinally, which I can't believe in since the sun is not even solidish?
|
|
|
|
Post by SDJ on Feb 24, 2010 14:04:02 GMT
My supercomputer ran out of space on the page.  All of the significant activity (which I defined as active regions with 50 or more spots) occurred within +/- 30 degrees of the equator, possibly in an even narrower band of latitudes running along the equator, I'll check on that later. The level of activity beyond 30 degrees latitude was considerably less, that beyond 40 even more so. What caught my eye was the two "holes" that had no significant activity and the three "clumps" of activity in longitudinal terms. I'm working to plot the data on a smaller scale, but that takes some time since I only do it while relaxing. I'm guessing there's some sort of non-uniformity in the core reaction that gets expressed at the "surface" as an uneven distribution of activity. What surprised me was the persistence over time, since the plot covers a period slightly longer than one full cycle. |
|
|
|
Post by jcarels on Feb 24, 2010 15:59:08 GMT
|
|
|
|
Post by SDJ on Feb 24, 2010 16:21:51 GMT
Yeah, I know all about the butterfly diagram.
What I'm looking at is the possibility of predicting the appearance or return of large regions that have a higher probability of significant activity during each rotation.
There was a very active region that appeared in mid-December, 2008, emitting several spectacular flares just as it passed off the west limb. I don't think it was given an AR number, although a smaller, less active region trailing just behind it was.
I'm also interested in the periodicity of large region activity, i.e., activity that appears during one or two rotations, then dies down for a while, only to reappear later. That's why I'm logging the plots I've been making of activity with Carrington rotation numbers to see if reoccurrences can be forecast.
It goes beyond the butterfly diagram.
|
|
|
|
Post by andrewuwe on Feb 25, 2010 9:46:53 GMT
If you could find a correlation between sunspot (size,activity,latitude, cycle position) and it's reappearance then that would be amazing.
I guess you would suffer from the lack of stereo data in the old records?
|
|
|
|
Post by SDJ on Feb 25, 2010 14:37:40 GMT
That's what I'm hoping to do, but I have quite a ways to go. So far, some intriguing things pop up, like this one: 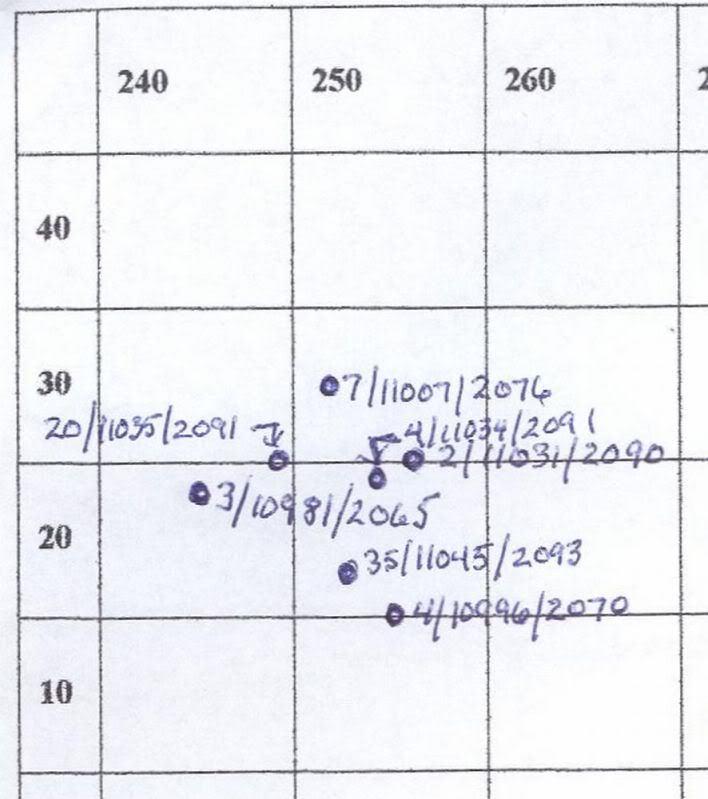 This covers the period since the start of Cycle 24, beginning with Carrington rotation 2065 and continuing into the current rotation 2093. It's just a clip from one of the plots that conveniently has the coordinates nearby. Active Region 10981 was declared to be the "first sunspots" of Cycle 24 in mid-January of 2008. The plot above shows what's happened in that region since then, including AR 11045 in the current rotation. Since I'm doing this by hand, and the data entries I'm using have some variation in both the latitude and longitude dimensions (they were done by individual people doing the sightings and recording the positions), there's some "moving around" of the locations, but it's beginning to look like a roughly 10 degree range may offer some promise. |
|
|
|
Post by SDJ on Feb 25, 2010 14:42:00 GMT
Sorry, once again I should have been clearer to avoid confusion.
The format of the data entered into the plot is Sunspot Count/Active Region Number/Carrington Rotation.
|
|
|
|
Post by SDJ on Feb 28, 2010 15:48:50 GMT
OK, here's another example of what I'm talking about. This is today's sunspot information: ------------------------------------------------------------------- Product: 0228SRS.txt Issued: 2010 Feb 28 0031 UTC # Prepared jointly by the U.S. Dept. of Commerce, NOAA, # Space Weather Prediction Center and the U.S. Air Force. # Joint USAF/NOAA Solar Region Summary SRS Number 59 Issued at 0030Z on 28 Feb 2010 Report compiled from data received at SWO on 27 Feb I. Regions with Sunspots. Locations Valid at 27/2400Z Nmbr Location Lo Area Z LL NN Mag Type 1050 S18W64 053 0000 Axx 00 02 Alpha 1051 N15E27 322 0030 Cao 06 04 Beta IA. H-alpha Plages without Spots. Locations Valid at 27/2400Z Feb Nmbr Location Lo None II. Regions Due to Return 28 Feb to 02 Mar Nmbr Lat Lo 1045 N19 ------------------------------------------------------------------------ Here's today's SOHO EIT 195 image showing AR 11051 at a Carrington Longitude of approximately 322 degrees (Lo in the above data): 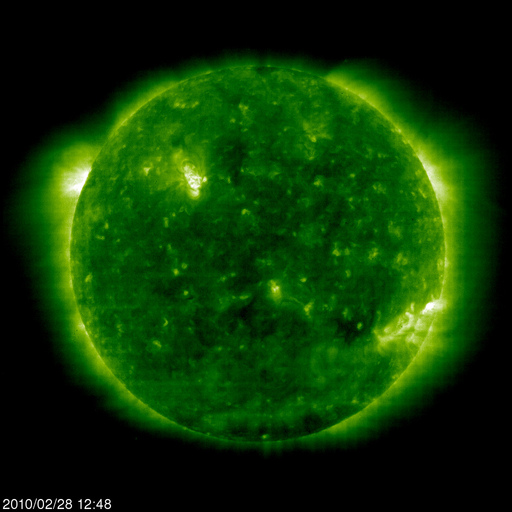 Here's my plot since Carrington Rotation 2065 (CR 2094 just started yesterday]: 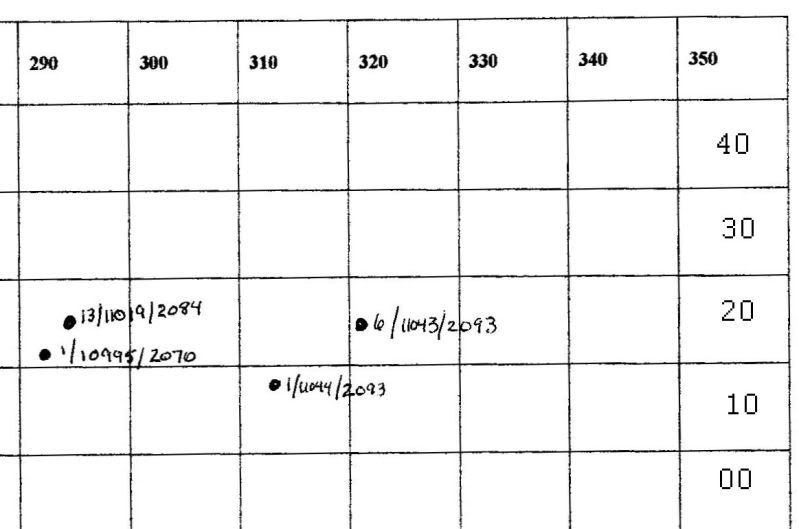 There was an active region nearby in longitudinal terms during the last rotation, 11043. The latitudes are a bit different, but they can vary by several degrees since they're being estimated by humans, and there seems to be a parallax effect the greater the distance from the centerline. The point is that the same general area had some limited activity last go-around. Eventually, I hope to go further back to see the history of activity starting several years ago. |
|
|
|
Post by SDJ on Feb 28, 2010 22:48:54 GMT
I'm getting close to finishing the plotting of all active regions since early 1996, with sunspot counts ranging from 1 to 119. It should take a few more days to complete, after which I'll start scanning the pages and will make them available via email to anyone who's interested. Each page covers 120 degrees longitude and 100 degrees latitude, to 50 north and south of the equator, which was sufficient for plotting every active region, although when a page gets too full, I start another one.
In the meantime, if anyone is interested in the raw data I'm working from, I have an Excel file with all of the SRS data files like the one I posted earlier today merged into it. With around 6 exceptions, it has data on every active region (ARs 7835 to 11048) on a daily basis, starting in January 2, 1996 and running up until a couple of weeks ago. I won't take long to bring it up to today, if there's interest.
Please contact me by email or private message if you'd like to have a look. The file is just over 2 MB, but I can zip it into something much smaller for anyone who has file size restrictions on their email account.
I'll post again when I begin scanning the plot images. The next step is singling out particular areas for a closer look.
|
|
grian
Level 2 Rank
 
Posts: 50
|
Post by grian on Mar 2, 2010 8:28:14 GMT
The thing is you're plotting points, arbitary points at that. I'm not sure where the published latitude and longitude of a spot group are taken from, p spot, centre or f spot, but they're just an arbitary point.
Activity isn't confined to just that point. For the bigger groups E or F class there's > 10o of longitude covered and for the larger groups maybe a latitude spread of up to 5o.
I suspect that if you were plotting areas around those chosen points then the "holes" would be smeared away.
|
|
|
|
Post by SDJ on Mar 2, 2010 8:47:35 GMT
I gave the data source at the top of the page.
The plots are based on averaging the locations given daily for each active region. The regions do vary in size, but not to an extent sufficient to "smear away" those areas of the solar "surface" that have shown no activity in 14 years.
I don't have an ulterior motive in this. I'm just trying to discover something.
|
|
grian
Level 2 Rank
 
Posts: 50
|
Post by grian on Mar 2, 2010 8:59:30 GMT
I don't have an ulterior motive in this. I'm just trying to discover something. Never said you did. However, I do think, for want of a better phrase, the measurement system you've adopted is a poor one and does not reflect activity accurately. And so any conclusions you draw from them are suspect. |
|
|
|
Post by SDJ on Mar 2, 2010 14:01:31 GMT
The people who compiled the data considered it important enough to note the position by latitude, longitude and Carrington longitude on a daily basis for each active group.
|
|