|
|
Post by missouriboy on May 3, 2016 16:33:45 GMT
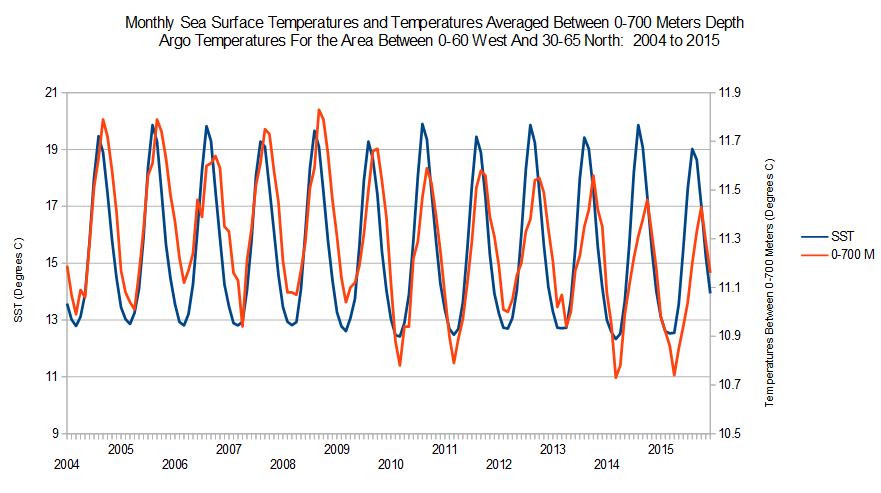
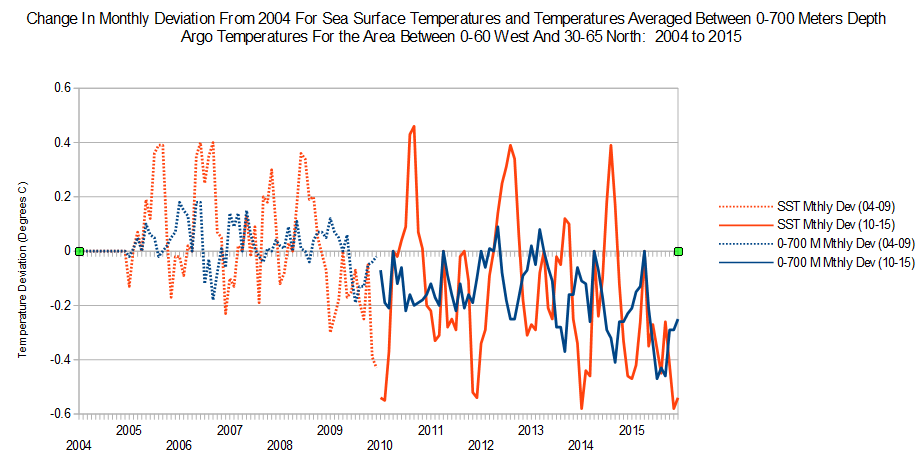
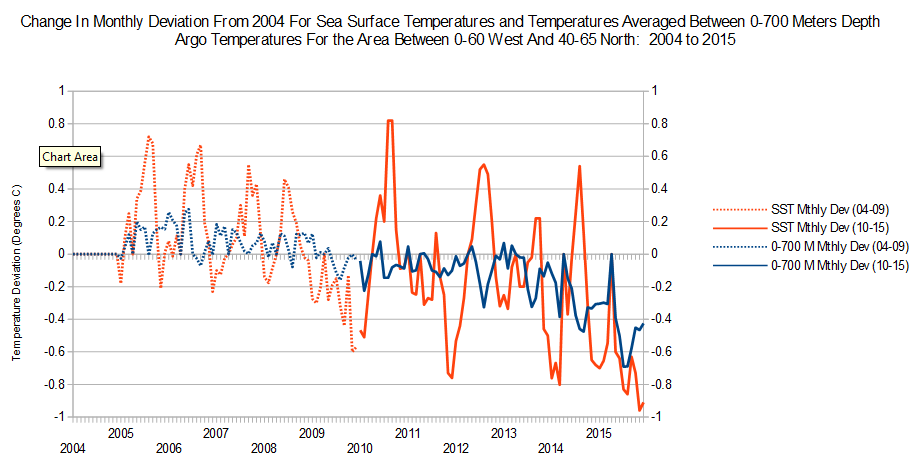
I agree, however it also the surface water that affects the weather above it, eg warm pacific waters have a noticeable effect (sometimes  ) The Pacific is well represented in temperature at depth and graphs are readily available which show the cold water pooling under the warm even now. ..your right, the surface temps do not give the reality of what is below the surface. We are dependant on helpful fellows like Missouriboy whose graphs from Argo data help reveal what lies beyond the ssta that we can see daily. From memory, these temperature (and salinity graphs) showed the ssta were representing the overall temperature within the N Atlantic area. Some graphs from some sources have recently been seen to over represent this, others like bob Tisdale offer a broader maybe more realistic look. Generally there us cooling, and meteorologists are accounting for this in their forecasts. No one really can explain it This is also a response to the postings on the Arctic Ice thread. I hadn't looked at the N Atlantic for a while, so went back and took a new look. Indeed there appears that there are related but different things occurring at depth than at the surface. This should not be a surprise as warm waters do tend to pool on the surface. I was looking for a relationship between SSTs and deeper waters when I teased the following out of Argo. The first graph seems to show that water temperatures at depth are cooling at a faster rate than surface waters between 30-65 N, 0-70 W. When you look at monthly temperature deviations from the same month in 2004 (Graph 2 - Argo year 1), one indeed notes these differences at depth. Simple linear regressions on each depth series show the same thing. But these mask some very interesting fluctuations in the the ranges between seasonal temperature deviations. At depth there is a fairly consistent temperature deviation range across the temperature decline from 2004 to 2015. However, note the dramatic change in the seasonal temperature range in the SSTs beginning in about 2009. The relatively tight range of 2004-2009 becomes quite dramatic from late 2009 to 2015. The range of the seasonal swing doubles. Also note that there is a well-defined annual swing in the 2004-09 period. This changes to a two-year increment from 2009-15. Is this what happens on the transition to a lower-temperature state as the decline continues? Will 2016 show a summer rebound to the 2014 heights ... OR?  Do we see a new reset back to a tighter seasonal range on the surface ... only at a lower temperature ... and when? Hold onto your butts! The Titanic may be taking a dive!    I went back and recalculated the above graph for 40-65 North. Thirty-eight to forty north latitude is about where the NAD separates from the N Atlantic Sub-tropical gyre. As you will note, the amplitude of the temperature waves since 2009 are even greater. In fact, when you drop south of that magic east-west line, the amplitude of the signal flattens out dramatically.  |
|
|
|
Post by acidohm on May 3, 2016 16:39:10 GMT
Thankyou Missouriboy....nice graphics, much appreciated!!
|
|
|
|
Post by nonentropic on May 3, 2016 19:08:39 GMT
is this a worry? MB
|
|
|
|
Post by missouriboy on May 3, 2016 20:41:42 GMT
Not unless you're on the business end of a colder climate. That's a guess. When I see a signal in the data where the amplitude of the wave expands dramatically from what is 'assumed' to be an existing steadier state, my gut says something is about to change. In this case, I would guess we are going to see a temperature drop to a new level. This is probably not unrelated to the increasingly extreme meridional flows we have been seeing in the atmosphere. But, then again, I could be full of it.  It will be interesting to see what happens. But SC24 is winding down, and if SC25 is even lower, then a drop to a new energy level would not be unexpected ... assuming that our sun plays a role in our planet's energy balance. That, of course, is heresy. |
|
|
|
Post by Ratty on May 4, 2016 0:27:09 GMT
Thankyou Missouriboy....nice graphics, much appreciated!! I second that. MB, what do you use for your graphing? Is there something in the public domain that is worth looking at? |
|
|
|
Post by missouriboy on May 4, 2016 0:52:59 GMT
Thankyou Missouriboy....nice graphics, much appreciated!! I second that. MB, what do you use for your graphing? Is there something in the public domain that is worth looking at? I just use OpenOffice. Not as high-tech as some, but it's a free download ... and its spreadsheet functions just like Microsoft Excel. All my graphs are straight out of the spreadsheet. |
|
|
|
Post by Ratty on May 4, 2016 1:06:25 GMT
Thanks MB. I've fiddled with Excel. Looks like I might have to put in some extra effort.
|
|
|
|
Post by nautonnier on May 4, 2016 10:12:56 GMT
It will be interesting to see what happens. But SC24 is winding down, and if SC25 is even lower, then a drop to a new energy level would not be unexpected ... assuming that our sun plays a role in our planet's energy balance. That, of course, is heresy. What will be interesting will be the gap between SC24 and SC25. There was a long quiescent spotless gap between SC23 and the definite start of SC24, if we see the same gap between SC24 and SC25 then it is time to become concerned about cooling. |
|
|
|
Post by acidohm on May 4, 2016 11:55:03 GMT
It will be interesting to see what happens. But SC24 is winding down, and if SC25 is even lower, then a drop to a new energy level would not be unexpected ... assuming that our sun plays a role in our planet's energy balance. That, of course, is heresy. What will be interesting will be the gap between SC24 and SC25. There was a long quiescent spotless gap between SC23 and the definite start of SC24, if we see the same gap between SC24 and SC25 then it is time to become concerned about cooling. Not too long to wait.... |
|
|
|
Post by missouriboy on May 4, 2016 14:27:13 GMT
It will be interesting to see what happens. But SC24 is winding down, and if SC25 is even lower, then a drop to a new energy level would not be unexpected ... assuming that our sun plays a role in our planet's energy balance. That, of course, is heresy. What will be interesting will be the gap between SC24 and SC25. There was a long quiescent spotless gap between SC23 and the definite start of SC24, if we see the same gap between SC24 and SC25 then it is time to become concerned about cooling. If it's long and low, it could be a cheerless winter of 20-21. |
|
|
|
Post by sigurdur on May 4, 2016 20:51:04 GMT
Remember, that the oceans act as a buffer to the sun. IT takes years to accumulate energy, and it also takes years for the oceans to express said energy.
Also, there are currents that are potentially 1500 year currents. Does these happen in relation to Bond Cycles?
|
|
|
|
Post by missouriboy on May 5, 2016 19:01:48 GMT
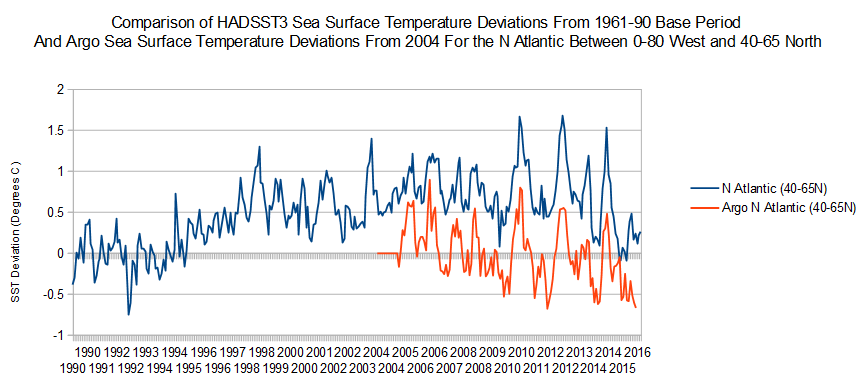
What will be interesting will be the gap between SC24 and SC25. There was a long quiescent spotless gap between SC23 and the definite start of SC24, if we see the same gap between SC24 and SC25 then it is time to become concerned about cooling. Cooling? I don't think so. Oh I dunno! May depend on where you live. North Atlantic SSTs are back to where they were in 1995, the end of the last negative AMO. HADSST3 or Argo ... take your choice. They're all pointed South. Twenty years worth of heat gone in five. The ocean may serve as an effective buffer to dramatic changes, but in this small area of the Worldwide Holy Sea, this sure looks dramatic. And, might I note that the deviations between the HADSST3 and Argo deviations seem to be getting larger. All the King's horses and all the King's men .....  |
|
|
|
Post by acidohm on May 5, 2016 19:14:19 GMT
The sea of Othotsk (I had to look that one up!) and east is also looking pretty chilly, perhaps more so then N Atlantic??
|
|
|
|
Post by nautonnier on May 5, 2016 19:30:09 GMT
What will be interesting will be the gap between SC24 and SC25. There was a long quiescent spotless gap between SC23 and the definite start of SC24, if we see the same gap between SC24 and SC25 then it is time to become concerned about cooling. Cooling? I don't think so. You may want to read this Relationship between Solar Cycle Length and Global Temperature Anomalies One of many similar papers |
|
|
|
Post by missouriboy on May 5, 2016 19:39:50 GMT
The sea of Othotsk (I had to look that one up!) and east is also looking pretty chilly, perhaps more so then N Atlantic?? Where did you get your data? |
|
 )
) Do we see a new reset back to a tighter seasonal range on the surface ... only at a lower temperature ... and when?


