|
|
Post by acidohm on May 20, 2016 5:08:56 GMT
Absolutely Ratty, I guess what your observations really highlight is how much ssta of bodies of water change, especially in a year!
Could be coincidence, but very unusual I think that N Atlantic looks so similar.
|
|
|
|
Post by sigurdur on May 28, 2016 15:37:07 GMT
|
|
|
|
Post by Ratty on May 28, 2016 22:01:07 GMT
From the letter: Can you conclude probably ? ? ? |
|
|
|
Post by sigurdur on May 28, 2016 22:26:44 GMT
Only if you are probably a climate scientist Ratty.
|
|
|
|
Post by phydeaux2363 on May 28, 2016 22:57:32 GMT
From the letter: Can you conclude probably ? ? ? Plausible deniability, Mr. Ratty. When your prediction fails, you can just tell critics, "I didn't say what you say I said," and accuse your critics of being unfair. It's a set up for yelling "SQUIRREL" when you're proven wrong. Lawyers do it all the time. |
|
|
|
Post by missouriboy on May 29, 2016 0:55:51 GMT
From the letter: Can you conclude probably ? ? ? Plausible deniability, Mr. Ratty. When your prediction fails, you can just tell critics, "I didn't say what you say I said," and accuse your critics of being unfair. It's a set up for yelling "SQUIRREL" when you're proven wrong. Lawyers do it all the time. Does the term "SQUIRREL" have a particular meaning in Cajun parlance? Here, its utterance would be followed by a "VOLLEY".  |
|
|
|
Post by throttleup on May 29, 2016 15:12:11 GMT
From the letter: Can you conclude probably ? ? ? It's definitely possible! |
|
|
|
Post by acidohm on Jun 8, 2016 19:02:14 GMT
Things seem a bit warmer, although there is still a cool pool, 1st image last year, second image this year 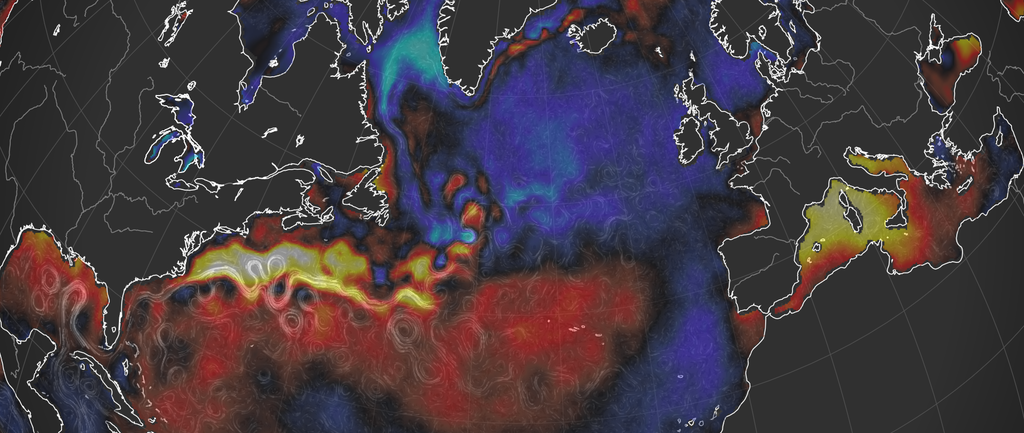 '> <img style="max-width:100%;" alt="" src='http:// 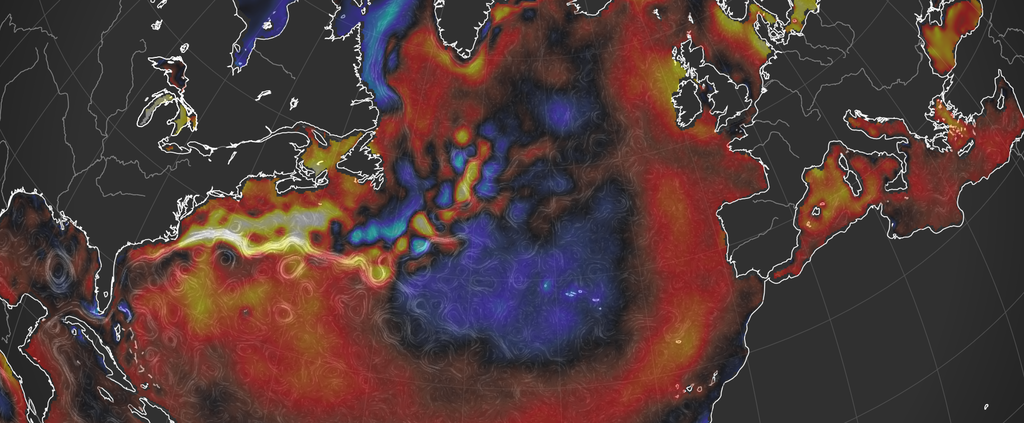 '> ![]() |
|
|
|
Post by missouriboy on Jun 9, 2016 2:20:41 GMT
The HADSST3 plots below show monthly SST deviations for the tropical N Pacific and areas of the N Atlantic from 1990 through April, 2016. Note that the N Atlantic north of 40 N latitude shows annual summer peaks, which, between 1998 and 2011, ranged from 1 to 1.4 C above normal. Starting in 2010, these summer peaks have only occurred every two years with twice the magnitude. Between 2010 and 2014, the winter minimums were similar to those from 2001 to 2009, but during the last two winters they have dropped to levels not seen since about 1995 ... when the N Atlantic went into its last warm cycle. This year would be the next two-year cycle, but the peak temps may be lower. We will see. Note the buildup of heat in the West-Central Atlantic (i.e., along the East coast of the US. In past years, 2010 and 2012, this buildup was followed by a spike north of 40 N. This years spike is diminishing and no sign yet (thru April - normally peaks in July-Aug.) of the heat north of 45 N. Also, some of the biggest spikes in the north have occurred in the year following an El Nino. The last two years look very much like we are dropping off an edge that leads to a negative AMO, and it appears to be occurring relatively quickly. 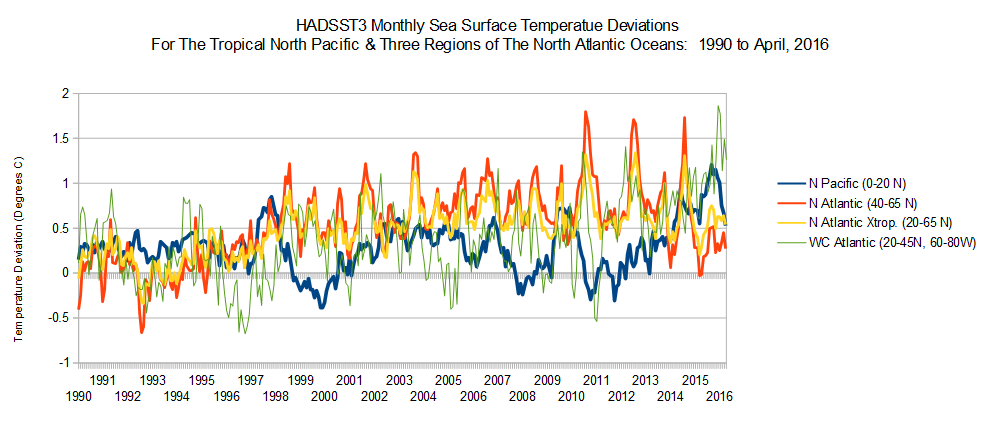 The second chart is the same except I've inserted the tropical Atlantic (0-20 N). Note the spikes after the 1997 and 2009 El Ninos. Doesn't appear to be happening this time (yet - it's past due). 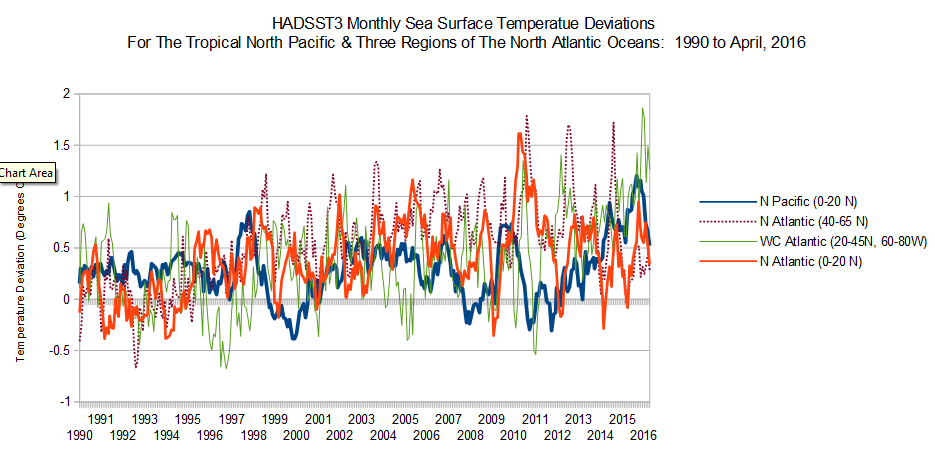 |
|
|
|
Post by missouriboy on Jun 9, 2016 3:27:26 GMT
Arctic Seas Temperature Deviations From the North AtlanticFrom 1998 to 2011 SSTs for the North, Norwegian and Barents Seas generally followed the trend for the N Atlantic north of 40 N latitude. Since 2011, temperature deviations in these three Seas have increased while N Atlantic SSTs have declined. Geothermal??? 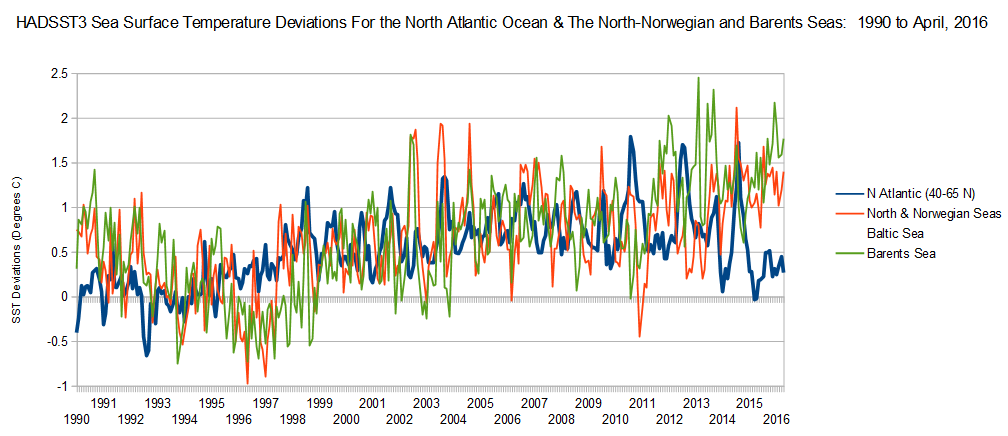
|
|
|
|
Post by Ratty on Jun 9, 2016 4:54:02 GMT
Arctic Seas Temperature Deviations From the North AtlanticFrom 1998 to 2011 SSTs for the North, Norwegian and Barents Seas generally followed the trend for the N Atlantic north of 40 N latitude. Since 2011, temperature deviations in these three Seas have increased while N Atlantic SSTs have declined. Geothermal???  You could be right, MB, but I think I see isotopic CO2 fingerprints in those Northern seas.   |
|
|
|
Post by missouriboy on Jun 9, 2016 13:07:09 GMT
Arctic Seas Temperature Deviations From the North AtlanticFrom 1998 to 2011 SSTs for the North, Norwegian and Barents Seas generally followed the trend for the N Atlantic north of 40 N latitude. Since 2011, temperature deviations in these three Seas have increased while N Atlantic SSTs have declined. Geothermal??? You could be right, MB, but I think I see isotopic CO2 fingerprints in those Northern seas.   Does this chart show what we might call 'nested drivers'? The longer-term North-Norwegian & Barents Sea temperature deviations generally follow the North Atlantic Trends ... but, they are punctuated at about 20-year intervals by volcanic/Geothermal(?) activities that 'fire up' the Arctic Seas temperatures. And note this post for current activity and speculation. www.telegraph.co.uk/news/science/9195178/Iceland-volcano-and-you-thought-the-last-eruption-was-bad....htmlHowever Ratty ... you may be correct! Every 20 years something really fires up those little CO2 gophers and they really start shoveling like crazy. Motivational seminars???  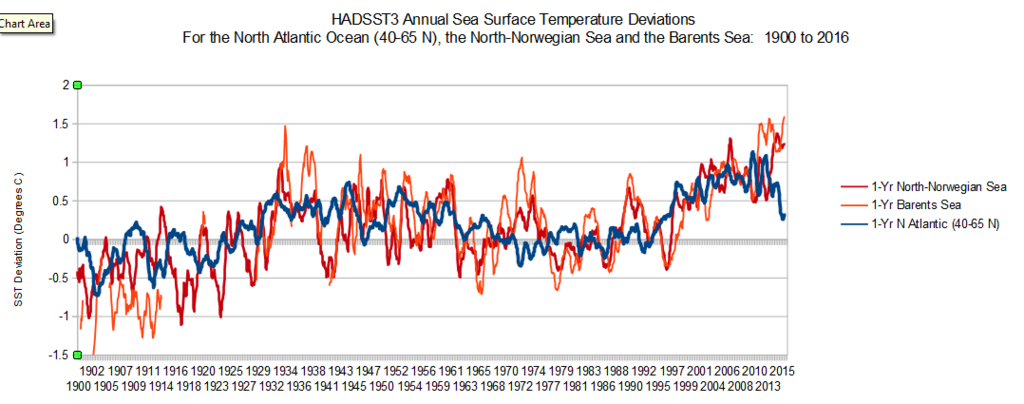 |
|
|
|
Post by Ratty on Jun 9, 2016 22:12:35 GMT
" Motivational seminars???  " Possibly. I've been to a few that generated a lot of hot air.  |
|
|
|
Post by acidohm on Jun 10, 2016 16:34:48 GMT
The HADSST3 plots below show monthly SST deviations for the tropical N Pacific and areas of the N Atlantic from 1990 through April, 2016. Note that the N Atlantic north of 40 N latitude shows annual summer peaks, which, between 1998 and 2011, ranged from 1 to 1.4 C above normal. Starting in 2010, these summer peaks have only occurred every two years with twice the magnitude. Between 2010 and 2014, the winter minimums were similar to those from 2001 to 2009, but during the last two winters they have dropped to levels not seen since about 1995 ... when the N Atlantic went into its last warm cycle. This year would be the next two-year cycle, but the peak temps may be lower. We will see. Note the buildup of heat in the West-Central Atlantic (i.e., along the East coast of the US. In past years, 2010 and 2012, this buildup was followed by a spike north of 40 N. This years spike is diminishing and no sign yet (thru April - normally peaks in July-Aug.) of the heat north of 45 N. Also, some of the biggest spikes in the north have occurred in the year following an El Nino. The last two years look very much like we are dropping off an edge that leads to a negative AMO, and it appears to be occurring relatively quickly.  The second chart is the same except I've inserted the tropical Atlantic (0-20 N). Note the spikes after the 1997 and 2009 El Ninos. Doesn't appear to be happening this time (yet - it's past due).  Genuinely Missouriboy, your graps and use of locations are some of the more interesting I see anywhere! But then I am very immersed in this area!! I had not seen the link between nino and NA sst before, I wonder what the physical link could be?? Dya think this is part of curry's stadium wave?? Also, Katla is not on the alert list right now, it's still Bardabunga which has had 4mg earthquakes and appears to be inflating again, I find the idea of magma heating water interesting. ..it would explain the northern warmth. |
|
|
|
Post by nonentropic on Jun 10, 2016 19:34:05 GMT
I have never seen a realistic demonstration that even a large volcano sub-sea could warm a region of water.
Water has a large heat capacity is this in fact true, does anyone have a paper that covers this?
|
|