|
|
Post by socold on Sept 11, 2008 7:51:30 GMT
There's no reason to believe that though. Someone could create a website called www.satellitetemps.org in a similar vein to surfacestations.org, it would mean nothing. The two satellite records actually disagree more between each other than the surface records do, so I don't see how they can be described as "more accurate". They aren't even measuring the same thing. Satellite measurements are taken as more accurate as they take the temperatures from wide areas of the planet and, tend not to be affected by the UHI and the associated clever 'correction' algorithms to make up for no mis-sited antique thermometers inside 500 miles. On the flip side the surface records tend not to be affected by clever 'correction' algorithms to make up for satellite drift and stratospheric cooling. The UAH satellite record had an error discovered in 2005 in it's satellite drift correction method. Correction of which increased the trend for the entire record by 40%. Still today the RSS record shows a greater warming trend over the past 30 years than any of the surface records (~0.17C/decade) while the UAH record shows less than any of the surface records (~0.13C/decade). So there's at least 0.04C/decade uncertainty in the satellite records. |
|
|
|
Post by socold on Sept 11, 2008 8:00:32 GMT
There's no reason to believe that though. Someone could create a website called www.satellitetemps.org in a similar vein to surfacestations.org, it would mean nothing. The two satellite records actually disagree more between each other than the surface records do, so I don't see how they can be described as "more accurate". They aren't even measuring the same thing. Go to the site surfacestations and take an educated look. Weather stations around America are hilarious - sited in car parks, next to AC units, on roofs, next to fireplaces etc - somehow I dont get the feeling satellite temps have the same issue. That's precisely because they were designed as weather stations, not climate stations. When someone first decided to compile a temperature record of America they had to accept the fact that available local temperature data was from weather stations with problems like this, they couldn't go back in time and sort it out. So the approach was to statistically detect and correct for these issues. Once that is found to work the record is updated year by year. surfacestations is just an effort in inuendo, it doesn't tell us anything is wrong with the surface records, only individual surface stations. |
|
|
|
Post by tacoman25 on Sept 11, 2008 8:39:20 GMT
Satellite measurements are taken as more accurate as they take the temperatures from wide areas of the planet and, tend not to be affected by the UHI and the associated clever 'correction' algorithms to make up for no mis-sited antique thermometers inside 500 miles. On the flip side the surface records tend not to be affected by clever 'correction' algorithms to make up for satellite drift and stratospheric cooling. The UAH satellite record had an error discovered in 2005 in it's satellite drift correction method. Correction of which increased the trend for the entire record by 40%. Still today the RSS record shows a greater warming trend over the past 30 years than any of the surface records (~0.17C/decade) while the UAH record shows less than any of the surface records (~0.13C/decade). So there's at least 0.04C/decade uncertainty in the satellite records. This has been addressed here before. Look at the starting points for the different metrics, and that will solve a good deal of the major differences in warming trends. It's not much of a mystery. And to claim that the satellite data is more open to correction than the surface data is ridiculous. The satellite data encompasses much more area and is less open to random adjustments. |
|
|
|
Post by socold on Sept 11, 2008 11:11:50 GMT
On the flip side the surface records tend not to be affected by clever 'correction' algorithms to make up for satellite drift and stratospheric cooling. The UAH satellite record had an error discovered in 2005 in it's satellite drift correction method. Correction of which increased the trend for the entire record by 40%. Still today the RSS record shows a greater warming trend over the past 30 years than any of the surface records (~0.17C/decade) while the UAH record shows less than any of the surface records (~0.13C/decade). So there's at least 0.04C/decade uncertainty in the satellite records. This has been addressed here before. Look at the starting points for the different metrics, and that will solve a good deal of the major differences in warming trends. It's not much of a mystery. And to claim that the satellite data is more open to correction than the surface data is ridiculous. The satellite data encompasses much more area and is less open to random adjustments. I didn't claim it was more open to correction, I claimed it's not necessarily more accurate. UAH version 5.1 didn't differ from the current 5.2 in that it encompassed much more area that the surface record and was less open to random adjustments, yet it was obviously quite inaccurate. Both records are simply attempts to estimate a real value. The surface record may actually be closer to the surface temperature actual than the satellite record is to the lower troposphere temperature actual. It's hard to say either way and in fact both may have such a negliable inaccuracy to be irrelevant. It's not anywhere near as obvious as surfacestations.org exists therefore the surface record is proven to be inaccurate. |
|
|
|
Post by ron on Sept 11, 2008 13:20:30 GMT
Too bad we can't just stick a nice mercury thermometer up the South Pole.
I wonder at what depth you'd find exactly 37C?
As a serious point... OMG; I looked at the list of 500+ weather stations and that 70% of them are in the 4 or 5 error zone. That is hilarious. Or it would be if it weren't determining public policy.
So I decided that I would "get involved" and go check out any stations near me. Unfortunately, they have closed them all, best I can tell.
I especially liked the ones that were near airports and had lights installed on or even inside the shelters. The one on the flat rooftop next to the 3 ton commercial air conditioning unit was particularly funny; and the one in a chain-link fenced off area in the middle of a parking lot with a trash burning drum adjacent to it was a good one. Of course the one in the water treatment plant was a good one somebody sniffed out.
|
|
|
|
Post by tacoman25 on Sept 11, 2008 16:23:16 GMT
This has been addressed here before. Look at the starting points for the different metrics, and that will solve a good deal of the major differences in warming trends. It's not much of a mystery. And to claim that the satellite data is more open to correction than the surface data is ridiculous. The satellite data encompasses much more area and is less open to random adjustments. I didn't claim it was more open to correction, I claimed it's not necessarily more accurate. UAH version 5.1 didn't differ from the current 5.2 in that it encompassed much more area that the surface record and was less open to random adjustments, yet it was obviously quite inaccurate. Both records are simply attempts to estimate a real value. The surface record may actually be closer to the surface temperature actual than the satellite record is to the lower troposphere temperature actual. It's hard to say either way and in fact both may have such a negliable inaccuracy to be irrelevant. It's not anywhere near as obvious as surfacestations.org exists therefore the surface record is proven to be inaccurate. But think about it, socold. Even if the surface record more accurately represents what's going on right at the surface, the troposphere data represents a bigger picture of the earth's temperature trends. If global warming is truly occurring, it should be represented clearly in both the surface AND satellite record. And for the most part, the surface data and satellite data match pretty well. |
|
|
|
Post by twawki on Sept 11, 2008 23:21:13 GMT
Go to the site surfacestations and take an educated look. Weather stations around America are hilarious - sited in car parks, next to AC units, on roofs, next to fireplaces etc - somehow I dont get the feeling satellite temps have the same issue. That's precisely because they were designed as weather stations, not climate stations. When someone first decided to compile a temperature record of America they had to accept the fact that available local temperature data was from weather stations with problems like this, they couldn't go back in time and sort it out. So the approach was to statistically detect and correct for these issues. Once that is found to work the record is updated year by year. surfacestations is just an effort in inuendo, it doesn't tell us anything is wrong with the surface records, only individual surface stations. weather stations instead of climate stations - where did you get that from!!!! |
|
|
|
Post by twawki on Sept 11, 2008 23:21:59 GMT
Satellite measurements are taken as more accurate as they take the temperatures from wide areas of the planet and, tend not to be affected by the UHI and the associated clever 'correction' algorithms to make up for no mis-sited antique thermometers inside 500 miles. On the flip side the surface records tend not to be affected by clever 'correction' algorithms to make up for satellite drift and stratospheric cooling. The UAH satellite record had an error discovered in 2005 in it's satellite drift correction method. Correction of which increased the trend for the entire record by 40%. Still today the RSS record shows a greater warming trend over the past 30 years than any of the surface records (~0.17C/decade) while the UAH record shows less than any of the surface records (~0.13C/decade). So there's at least 0.04C/decade uncertainty in the satellite records. I havnt said the satellite record is perfect but I tend to think it is more accurate. Lets take this to a new thread as its getting off topic here |
|
|
|
Post by twawki on Sept 12, 2008 0:14:42 GMT
Spring finally thaws NSW frost
Tom Saunders, Thursday September 11, 2008 - 17:02 EST
Inland parts of NSW woke to another morning of widespread severe frost on Thursday with minimum temperatures dropping as much as 10 degrees below average.
Braidwood dropped to a bitter minus seven degrees, their coldest September night in at least 18 years. Other notable extremes included minus eight at Cooma and minus five at Orange and Nerriga.
Western suburbs of Sydney also woke to frost with Liverpool and Richmond recording lows of just one while Badgerys Creek nudged zero. Sydney’s CBD dropped to seven for the second consecutive morning, the city’s coldest two night spell in September for 13 years.
The late winter frosts are the result of a very dry and stable airmass lingering over NSW beneath a high pressure system. Thankfully the cold spell has now come to an end with a much warmer northwesterly airstream set to develop over NSW during the next few days.
- Weatherzone
© Weatherzone 2008
Also looking at temp drop on monday of about 10c as a new front moves through
Mt Ruapehu snow depths going up again with another 20cm of snow.
|
|
|
|
Post by twawki on Sept 16, 2008 9:50:32 GMT
Gee were normally getting snowmelt by now in Oz but the resorts copped another dump of 20cm snow yesterday with more snow later in week
..................................................................
Frost replaces gales over southeastern Australia
Tom Saunders, Tuesday September 16, 2008 - 17:39 EST
Wild winds eased over southeastern Australia today, allowing repair work to begin on widespread damage caused by fallen trees.
Gusts during the morning still reached over 90km/h in southern Victoria and Tasmania but dropped below gale force by early afternoon. Hogan Island in northern Bass Straight recorded a 132km/h gust at 5am, equal to winds generated by a category two tropical cyclone.
Winds will ease further overnight as the front responsible for the gales heads towards New Zealand, allowing for widespread frost.
Temperatures are forecast by weatherzone to plummet as much as seven degrees below average on Wednesday morning, falling below zero over much of the southeast inland. A frost warning has been issued for much of Victoria with locally severe frosts possible over inland regions.
- Weatherzone
© Weatherzone 2008
|
|
|
|
Post by twawki on Sept 17, 2008 11:36:26 GMT
On Aug. 17, 2008 Eyre in Western Australia registered a low temperature of -7.2 degrees C (19 degrees F), setting the record for the all-time lowest temperature for that Australian state, according to the Australian Bureau of Meteorology.
|
|
|
|
Post by Acolyte on Sept 17, 2008 12:56:11 GMT
[size=2]Melbourne Temperatures
			Max Mean	Max Low	Max High	Min Mean	Min Max	Min High
Aug-07 		17.3		13.1		25.7		8.9		3.3		15.3
Aug-08			14		9.9		16.6		7		3.2		9.9[/size]
That is an across-the-board lower set of figures. Source is the Bureau of Meteorology.
|
|
|
|
Post by twawki on Sept 17, 2008 21:41:16 GMT
hey aco - thats a huge drop - when were told to be concerned about a 0.6d c rise over 100 years but they go all quiet on significant drops its makes you wonder
|
|
|
|
Post by magellan on Sept 18, 2008 1:48:36 GMT
Satellite measurements are taken as more accurate as they take the temperatures from wide areas of the planet and, tend not to be affected by the UHI and the associated clever 'correction' algorithms to make up for no mis-sited antique thermometers inside 500 miles. On the flip side the surface records tend not to be affected by clever 'correction' algorithms to make up for satellite drift and stratospheric cooling. The UAH satellite record had an error discovered in 2005 in it's satellite drift correction method. Correction of which increased the trend for the entire record by 40%. Still today the RSS record shows a greater warming trend over the past 30 years than any of the surface records (~0.17C/decade) while the UAH record shows less than any of the surface records (~0.13C/decade). So there's at least 0.04C/decade uncertainty in the satellite records. Clever algorithm "adjustments" GISS uses in their data which are neither announced or explained would be cause for loss of lab certification if living by industry standards. Just from 1999 to 2001j for U.S. temps: 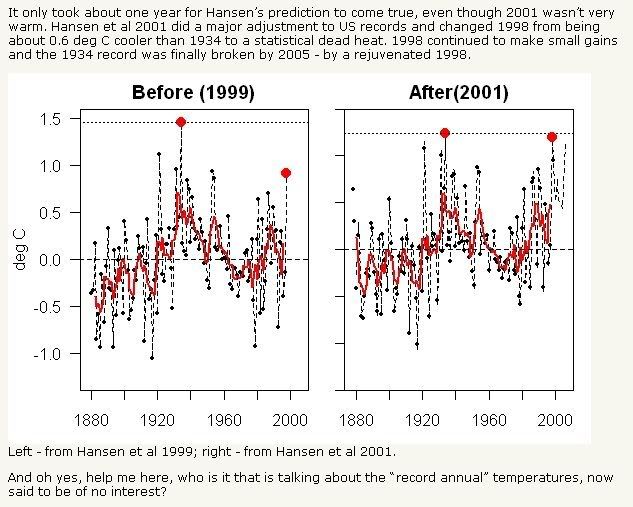 By 2007 the 1930's were all but washed away. As for UAH data, I put much more confidence in satellite data because as my living is made taking and analyzing data, there are certain flags I look for: 1) satellites are calibrated and verified to known standards and therefore can be adjusted even if at later dates. 2) satellites are maintained 3) UAH have their books open for scrutiny 4) the dirunal drift issue has been ameliorated. 5) the stratospheric cooling issue was erroneous see www.heartland.org/policybot/results.html?artId=15256 History of UAH adjustments. Note the 2005 error was within the margin of error.  RSS is not without their problems ftp.ssmi.com/msu/readme_jan_2008.txtFinally, a recent paper discusses the two satellite products and states UAH is the more accurate and RSS has a warming bias. www.agu.org/pubs/crossref/2008/2007JD008864.shtmlMy personal preference is to have the more accurate and precise data, not what supports my POV. Unfortunately, much of climate "science" with respect to measurement systems is junk science, that being the surface station network. Bottom line: the surface station network is not calibrated, is poorly maintained and the evidence to its warming bias is well documented in the literature.  |
|
|
|
Post by twawki on Sept 18, 2008 8:00:53 GMT
Great post - thanks  |
|


