|
|
Post by socold on Mar 24, 2016 21:03:23 GMT
Lindzens iris hypothesis predicted negative cloud feedback, or cloud cover increasing with warming
|
|
|
|
Post by sigurdur on Mar 24, 2016 22:36:33 GMT
Lindzens iris hypothesis predicted negative cloud feedback, or cloud cover increasing with warming You have that backwards Socold. That is why his hypothesis was attacked so hard. It went against AGW feedback theory. His hypothesis did present a negative feedback loop, but it was because of reduced cloud cover, hence allowing more radiation to escape to space. |
|
|
|
Post by sigurdur on Mar 24, 2016 22:37:30 GMT
|
|
|
|
Post by sigurdur on Mar 24, 2016 22:42:35 GMT
Lindzens iris hypothesis predicted negative cloud feedback, or cloud cover increasing with warming And in the case of Lindzen, he is the smartest guy of the bunch again. He knows more about AGW than the rest of the so called climate scientists combined. |
|
|
|
Post by sigurdur on Apr 5, 2016 20:51:04 GMT
|
|
|
|
Post by acidohm on Apr 5, 2016 21:24:38 GMT
What a graph!! Really produces more questions then anything. ...look at all those high readings in the LIA years!! How do they compare satellite era measuring capability with bucket on rope type measuring?? Good to see other means of posting info then attachments, good one. |
|
|
|
Post by Ratty on Apr 5, 2016 22:44:59 GMT
What a graph!! Really produces more questions then anything. ...look at all those high readings in the LIA years!! How do they compare satellite era measuring capability with bucket on rope type measuring?? Good to see other means of posting info then attachments, good one. The main word here is "reconstructed". |
|
|
|
Post by sigurdur on Apr 6, 2016 18:22:46 GMT
|
|
|
|
Post by acidohm on Apr 7, 2016 7:29:50 GMT
|
|
|
|
Post by missouriboy on Apr 7, 2016 15:37:45 GMT
And so it begins ... will it be with a bang? ... or a whimper? That sharp downward curve. Was that due to that great, warm meridianal sucking sound going north to that big, open barn door? The one we saw in multiples not so long ago. The one(s) that were going to melt the Arctic? Did we just shed a huge amount of heat? Lot of good questions in the comments. Stephen Wilde: " This is what happens when a quiet sun increases global cloudiness so as to reduce the amount of solar energy entering the oceans. The reduced rate of recharge will gradually reduce the intensity of El Ninos relative to La Ninas and lesd to a cooling world." Do we have recent cloud data on a regular (mthly) basis? Donald Kasper: "Looks to me like the Juan de Fuca plate volcanism has stopped." I keep reading these things. Are there any data at all? Doesn't seem to show up in Argo ... but that could be due to sample density? |
|
|
|
Post by missouriboy on Apr 7, 2016 15:55:53 GMT
Thanks Acid. I'd lost my link to this. The SSTs must be anomalies ... thus, I assume, so too are the std. deviations. Their size surprises me a bit. |
|
|
|
Post by missouriboy on Apr 9, 2016 2:52:26 GMT
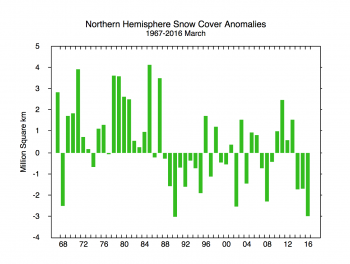
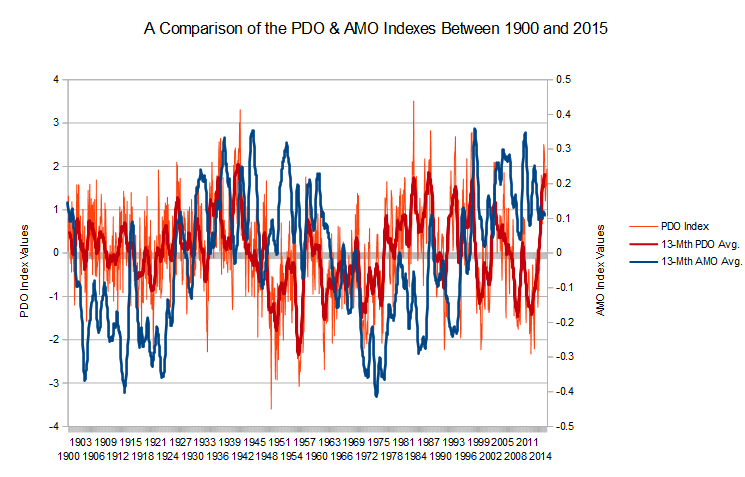
THE GREAT SNOW SHIFTI saw this in the nsidc.org/arcticseaicenews/ My first visual response was ... "What the heck happened in 1987?" We've all heard of the 'Great Climate Shift', which was when the PDO went positive in 1976. The years on the snowcover graph prior to 1976 were, on average, snowier than the 1981-2010 normal. During this period, the PDO and the AMO were both negative. The PDO went positive in 1976 and the majority of years from 1976 to 1986 got snowier. In 1987 the AMO went positive, although not consistently so till 1994. But both indexes are positive from that point. What am I missing here guys?  ?  
|
|
|
|
Post by acidohm on Apr 9, 2016 5:28:50 GMT
THE GREAT SNOW SHIFTI saw this in the nsidc.org/arcticseaicenews/ My first visual response was ... "What the heck happened in 1987?" We've all heard of the 'Great Climate Shift', which was when the PDO went positive in 1976. The years on the snowcover graph prior to 1976 were, on average, snowier than the 1981-2010 normal. During this period, the PDO and the AMO were both negative. The PDO went positive in 1976 and the majority of years from 1976 to 1986 got snowier. In 1987 the AMO went positive, although not consistently so till 1994. But both indexes are positive from that point. What am I missing here guys?  ?   How does snow extent match up to solar activity?? The 08-12 +ve extent at least correlates to the minimum... |
|
|
|
Post by fredzl4dh on May 3, 2016 12:29:57 GMT
|
|
|
|
Post by graywolf on May 3, 2016 12:50:36 GMT
|
|