|
|
Post by nautonnier on Dec 2, 2016 15:18:22 GMT
"So far in November.....in the US.....the ratio of "new record daily HIGH temperatures" to "new record daily LOW temperatures" is an astounding 63 to 1." Well that looks like a warm November for the lower 48? it goes on with "How astounding? I'm glad you asked. During the highest month ratio since 1920.....the prior record was 38 to 1 during February of 1992. During the "crazy" month of March 2012...the ratio was 32 to 1 (there were over 10,394 highs to 325 new lows). So far in November.....we only have 51 new record low temps in the US (that ties the old record of 51 from Feb of 1992). But we have 3,223 new record highs....and back in Feb 1992 there were only 1,960 new highs." I know you guys don't like 'measured temps' but I'm sure impacts on the ground are showing just how odd a month the u.S. has just had ( not just Tennessee!!!) It is called weather GW. I suspect from NOAA's latest forecasting that it will be the reverse in December with the probability that all of the US will be well below normal with the exception of southern Texas near Brownsville and Central and Southern Florida. I have some doubt that you will come here to say that though probably because the author of your quote will not publish things showing cold. This is called confirmation bias. If Theo is right and it appears from other weather around the world that he may be (despite the noise US is only around 2% of the Earth's surface)then you will also find yourself with some level of cognitive dissonance. |
|
|
|
Post by nautonnier on Dec 2, 2016 16:30:42 GMT
lsvalgaard participated in the comments and linked a paper www.leif.org/EOS/2011GL046658.pdfThe line that stood out for me was this: "The implied marginally significant decrease in TSI during the least active phases of the Maunder Minimum by 140 to 360 ppm relative to 1996 suggests that drivers other than TSI dominate Earth’s long‐term climate change." and what would those drivers be? In the conclusion of the paper the authors write: "If the 2008–2009 solar magnetic activity is indeed similar to the Maunder Minimum level as we argue here, then it would appear that drivers other than TSI dominate Earth’s long‐term climate change." and the beat goes on.... There is an over emphasis on TOTAL solar irradiance, rather than the Energy from Solar Irradiance that actually warms the Earth. If the frequency levels within the overall TSI change then for example the oceans may not be warmed as much as there is more long wave than short wave radiation. The overall energy from the Sun may be the same but the actual warming effect could be significantly different. Then there are other forms of energy that are claimed by some to have an impact such as the magnetic 'ropes' from the Sun. We are in unknown unknown territory and the solar scientists are gathered with the climate scientists around the lamppost as it is light over there. |
|
|
|
Post by sigurdur on Dec 2, 2016 17:20:52 GMT
The variation in the levels of UV is huge, while the TSI is stable.
There is some evidence that the UV levels play a role in jet stream placement. Have not read anything pertaining to Rosby waves, etc.
As you said Naut, unknown unknowns at this time.
|
|
|
|
Post by missouriboy on Dec 2, 2016 20:52:52 GMT
lsvalgaard participated in the comments and linked a paper www.leif.org/EOS/2011GL046658.pdfThe line that stood out for me was this: "The implied marginally significant decrease in TSI during the least active phases of the Maunder Minimum by 140 to 360 ppm relative to 1996 suggests that drivers other than TSI dominate Earth’s long‐term climate change." and what would those drivers be? In the conclusion of the paper the authors write: "If the 2008–2009 solar magnetic activity is indeed similar to the Maunder Minimum level as we argue here, then it would appear that drivers other than TSI dominate Earth’s long‐term climate change." and the beat goes on.... There is an over emphasis on TOTAL solar irradiance, rather than the Energy from Solar Irradiance that actually warms the Earth. If the frequency levels within the overall TSI change then for example the oceans may not be warmed as much as there is more long wave than short wave radiation. The overall energy from the Sun may be the same but the actual warming effect could be significantly different. Then there are other forms of energy that are claimed by some to have an impact such as the magnetic 'ropes' from the Sun. We are in unknown unknown territory and the solar scientists are gathered with the climate scientists around the lamppost as it is light over there. They need a 'humdinger' of a new light bulb. Because they're not doing too good so far.  |
|
|
|
Post by sigurdur on Dec 2, 2016 22:13:37 GMT
|
|
|
|
Post by nautonnier on Dec 3, 2016 17:36:16 GMT
Forecasts from NCEP to Dec 19   Looks a little chilly... |
|
|
|
Post by graywolf on Dec 3, 2016 20:24:59 GMT
not looking good for the Arctic then? once that cold air drops into the Atlantic those positive sst's are gonna fire up storm after storm and with low solar Atlantic blocking they will run up Eastern Greenland and into Barrentsz/Kara? We could See a 2012 repeat down the Eastern Seaboard but the UK will be spared from the storms this time by highs that might move into a 'Bartlett' position feeding us with air from the Azores ( I'd vote for that!)
Not good for Svalbard though? They are already evacuation homes as permafrost lets go under heavy rainfall ( their average temp might come in at 0c and not the average -6.7c?)so more storms being fired at them will not help things esp. if they are warm ,wet, storms?
|
|
|
|
Post by bryson on Dec 3, 2016 21:44:24 GMT
Theodore said it was going to turn much colder into 2017 way back in 2014 so I think we are seeing the transition.
|
|
|
|
Post by icefisher on Dec 4, 2016 2:58:36 GMT
Sure go ahead if you like. I see no reason to leave anything out. Of course I will deny everything.  I take my hat off to McIntyre and McKittrick. What i wrote is a summary of what I found reading quite a bit of the IPCC paperwork but unlike the work of McIntyre and McKittrick it lacks fundamental documentation and explicit references. Better get busy then ......  Thanks, BTW. Ratty, read Judith Curry today's article: ‘Truthiness’ and ‘factiness’ in politicized scientific debates. Its an excellent piece on the issues I was discussing regarding documentation and evidence. |
|
|
|
Post by Ratty on Dec 4, 2016 3:37:21 GMT
[ Snip ] Ratty, read Judith Curry today's article: ‘Truthiness’ and ‘factiness’ in politicized scientific debates. Its an excellent piece on the issues I was discussing regarding documentation and evidence. You mean ...... I've got to use a search engine! I thought YOU were my search engine, Ice. What a letdown ..... sigh.  For anyone interested, check this out: Link Icefisher Neglected to include |
|
|
|
Post by graywolf on Dec 6, 2016 18:10:16 GMT
So we have to take Nina out of the mix now? I'm thinking that the cold East coast is now looking favourite for the dominant factor this winter? Obviously this will lead to quite a bit of airmass musical chairs as plunges are chased by advection and the poor Strat ends up not knowing what season it is in never mind what it should be doing....... it's the Mesosphere that now has me thinking, just how much control does the mesosphere have at ground level???
|
|
|
|
Post by walnut on Dec 7, 2016 2:25:58 GMT
He outlines his specific predictions again at the top of this very thread. It is consistent with what he has been saying for years. I assume that you have already read it.
|
|
|
|
Post by missouriboy on Dec 7, 2016 5:14:19 GMT
Some time back Glenkoks, I believe, made the point that what we should really monitor are summer (growing season) temperatures. That seemed very sensible to me given our dependence on food supplies. A review of the CET daily mean temperature records since 1772 indicate that summer temperatures seem to be more seriously affected during major solar downturns than are winters. The four charts below show annual and decadal mean days per month whose average temperature was less than or greater than specific percentiles calculated across the 245 year period 1772 to 2016. I set these percentiles at 10, 25, 75 and 90. Charts 3 and 4 show extreme winter (Nov-Mar) values (<10th and > 90th percentile) and winter values in the upper and lower quartiles. Charts 1 and 2 show the same for summer (May-Sept). Practically all mean temperature change since 1772 is accounted for by changes in the upper and lower quartiles. Chart 1 definitively shows the 100 year cold period from 1810 to 1910 as defined by the mean number of extreme cold days per month. This period terminates abruptly in 1910, with the mean number of cold days declining dramatically, while the mean number of extreme warm days increase. This can also be seem in Chart 2 (<25th and >75th percentile). It would appear that this transition corresponds with the ramping up of the two-phase solar grand maximum and the consequent warming of the North Atlantic Drift. I need not point out (but I will  ) the shift in direction that has taken place since about 2007. Note the placement of summer 2015 in this series. One could probably expect more of these. In comparison, winter trends show a long, but relatively linear decline over these 2.5 centuries. Cold days have declined and warm days have increased. Interestingly, Tambora is distinguishable in these charts ... but its affects are not as dramatic as they are in the NE US temperature record. Tambora occurred in early 1815 ... after the Dalton Minimum was already in progress. There is very little difference in extreme or lower quartile winter months between the winters after Tambora and those immediately preceding it. The mean number of annual summer days less than the 10 percentile also shows little difference. There is an increase of about 2 days in the number of summer days less than the 25th percentile in 1816 and 1817 versus years preceding the eruption. Duwayne ... if you see this, your 30-year plateau (actually a peak) may be evident in this series. Less cold days, less clouds? 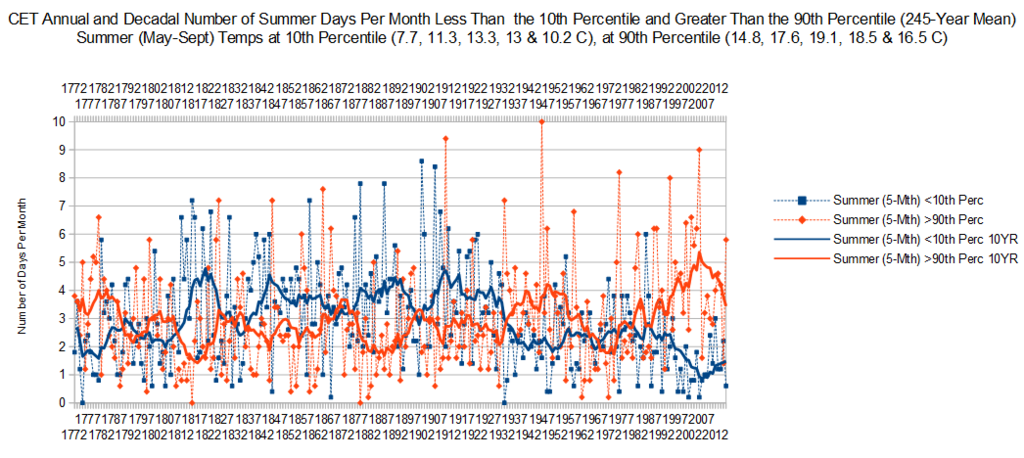 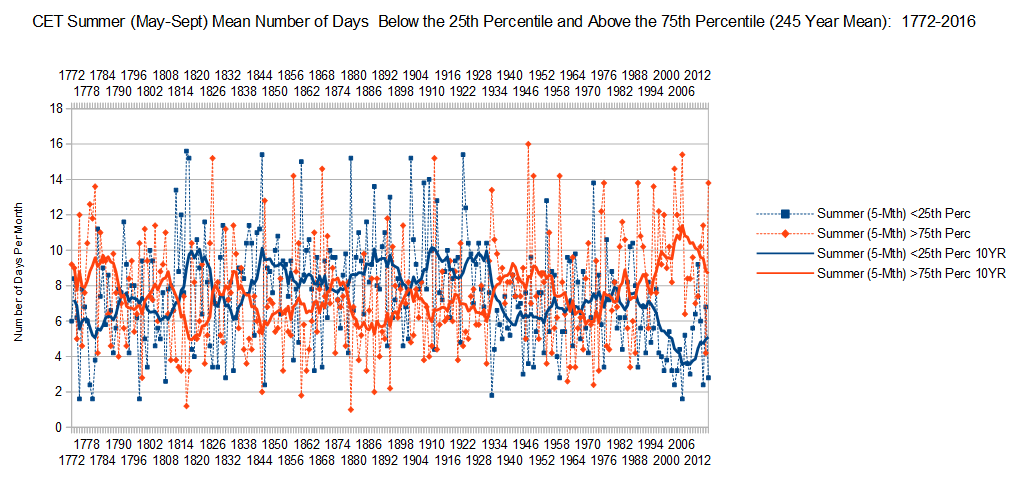 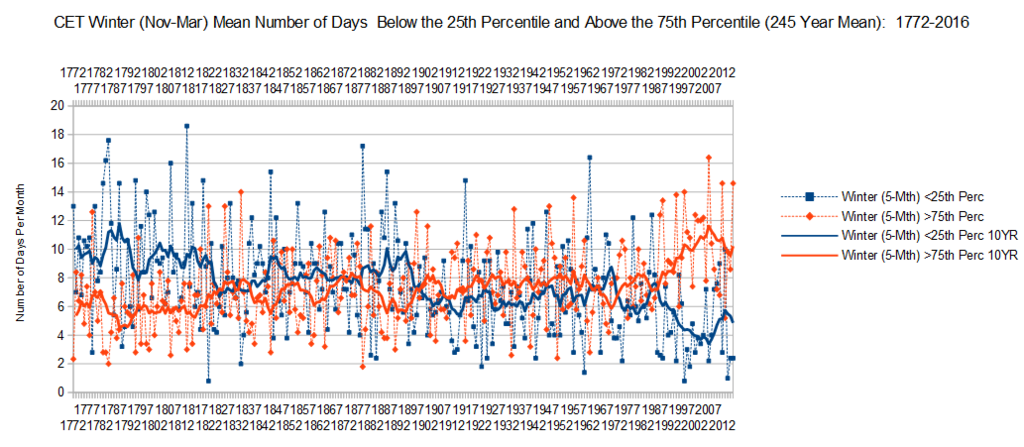 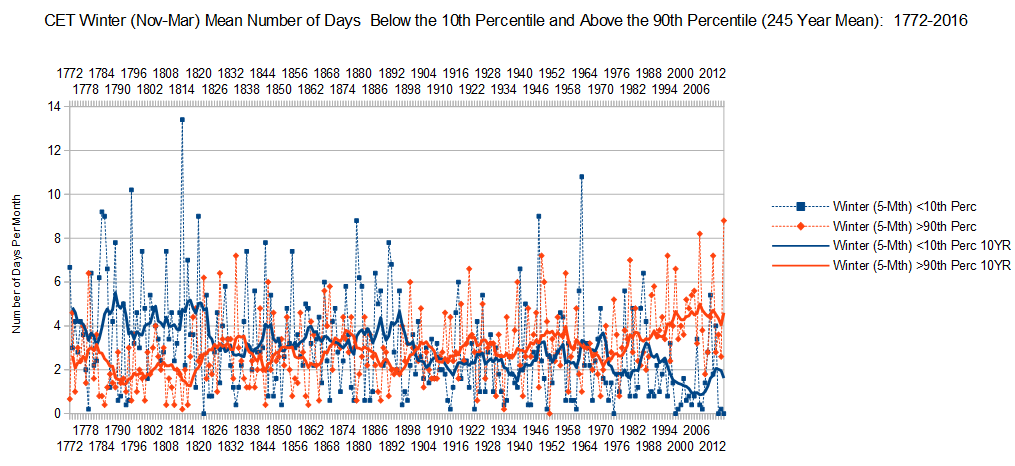 |
|
|
|
Post by Ratty on Dec 7, 2016 9:24:25 GMT
MissouryBoy, can you give me a precis of what you see in those charts wrt the future or past?
Begging the court's indulgence: The Schultz defence.
|
|
|
|
Post by sigurdur on Dec 7, 2016 15:30:13 GMT
???Ratty: Shake your head up and down rapidly 4 times. That will relieve the cobwebs............
|
|


 ) the shift in direction that has taken place since about 2007. Note the placement of summer 2015 in this series. One could probably expect more of these.