|
|
Post by nautonnier on Nov 3, 2020 18:36:38 GMT
|
|
|
|
Post by missouriboy on Nov 6, 2020 18:54:20 GMT
Weekly Solar Cycle 25 La Nina Progression for Nino Regions 3, 4 and 1+2, compared to Solar Cycles 23 and 24 for weeks beginning in January of the year la nina began. SC25 regions 3 and 4 are progressing in line with SCs 23 and 24. If this continues, expect a minimum around January, followed by a slight rise into summer, followed by a second wave decline into winter 2021-22. Those forecasting a record low La Nina must be expecting the seasonal "dead cat" bounce to be small or non-existent, with a continued downward direction. This should become apparent by spring. Nino Region 1+ 2 was very different for SC 23 and 24. Nina 24 had a positive northern hemisphere summer bounce in 2011 and 2012, whereas Nina 23 continued colder than normal in summer. So far, Nina 25 is following the early phases of Nino 24. 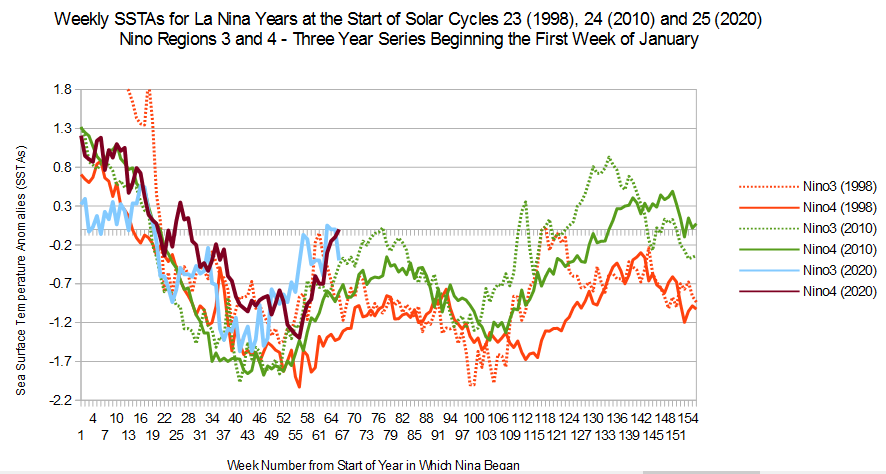 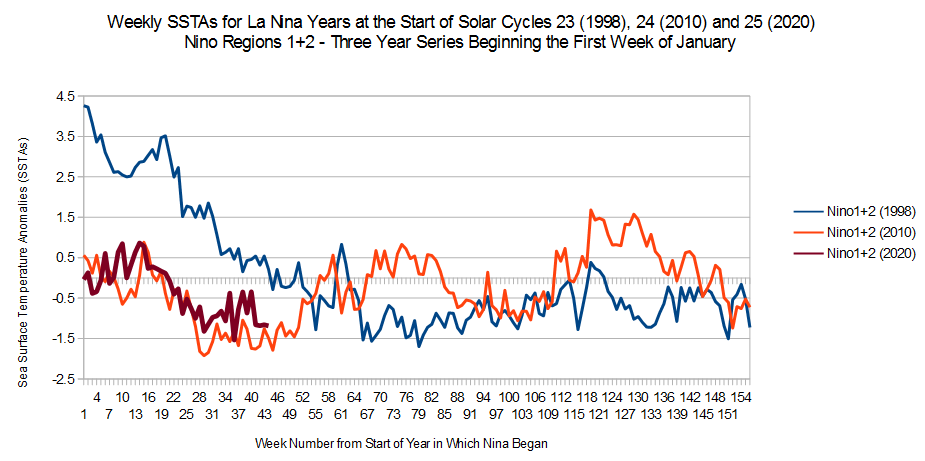 |
|
|
|
Post by missouriboy on Nov 6, 2020 20:28:37 GMT
ENSO and UAH Lower Troposphere TemperaturesThis graph is updated to October, 2020. UAH lower troposphere temperature anomalies have not yet been posted for geographic subdivisions. Only the global anomaly has been listed on Dr Roy's web site. The current global anomaly is holding in there, and so far, shows no drop associated with the building La Nina. Past UAH anomalies for the globe and the tropics have both risen and fallen with a lag following El Ninos. Lags have been longer with pre-cycle events. If this doesn't happen soon, some "SPLAINING" may be necessary.  UPDATE 11/10/20: UPDATE 11/10/20: UAH lower troposphere temperature for the sub-regions is in. Tropics are down to 0.37 C for October. 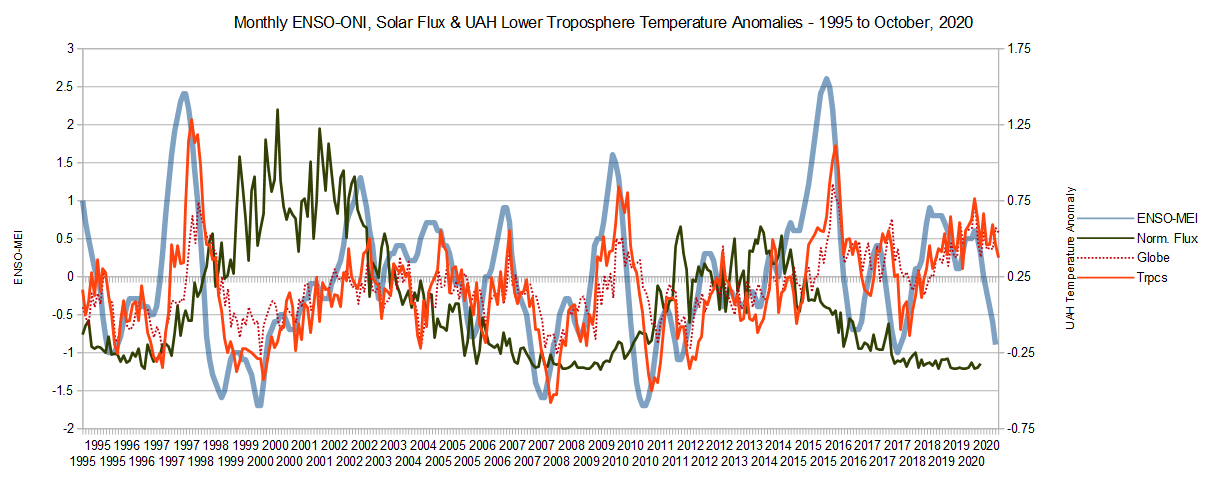
|
|
|
|
Post by missouriboy on Nov 11, 2020 3:37:54 GMT
|
|
|
|
Post by missouriboy on Nov 27, 2020 19:15:30 GMT
|
|
|
|
Post by missouriboy on Nov 28, 2020 15:18:17 GMT
|
|
|
|
Post by nautonnier on Nov 28, 2020 16:01:26 GMT
Add to that does the current weakening of the Earth's magnetic dipole affect the pump? and for Astromet is the magnetic dipole weakened by different planetary motion through the Sun's varying magnetic fields. 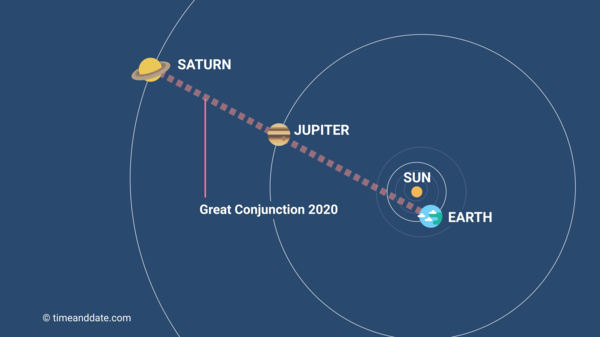 I wonder what Bary will be saying about this? Does it increase the chance of a nice Carrington X class CME just to round off 2020? |
|
|
|
Post by missouriboy on Nov 28, 2020 17:52:36 GMT
While creative license is allowed, portrayal of our star as a yellow dwarf is not funny ... and possibly racist.  |
|
|
|
Post by missouriboy on Dec 10, 2020 20:00:33 GMT
The Western Pacific Warm Pool and ENSO events: 1979 to 2020
I finally found an SSTA data base that allowed me to construct a time series for the Western Pacific Warm Pool. Climate4you now has a data series of SST anomalies for different equatorial transects across the Pacific. SSTAs for 130E-80E and 160E-80E allowed me to produce a 130E-160E estimate by simple subtraction. This is shown below in conjunction with SST deviations for Nino Regions 3 and 4. Seems to work. The western warm pool cools as Nino 3 and 4 heat up, and warms during the recharge periods between El Ninos. Note that the Warm Pool anomalies peak in the 1998-2012 period, and have declined dramatically since. If the warmth of western waters affect the strength/effect/warmth of central Pacific Ninos, then expect cooler waters during Nino events? It would seem logical, but we do not know how geo-thermal inputs (among others) may effect this assumption. 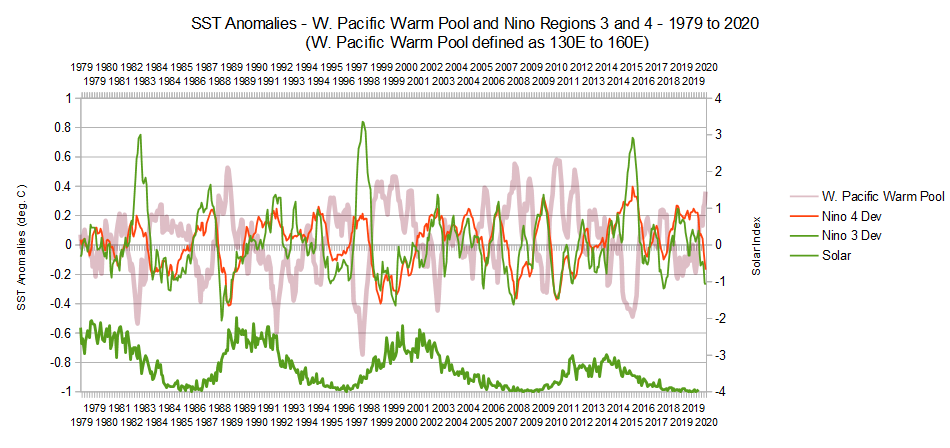
|
|
|
|
Post by missouriboy on Dec 16, 2020 20:53:03 GMT
ENSO & PDOCode. Your warm blob should be gone for the foreseeable future. 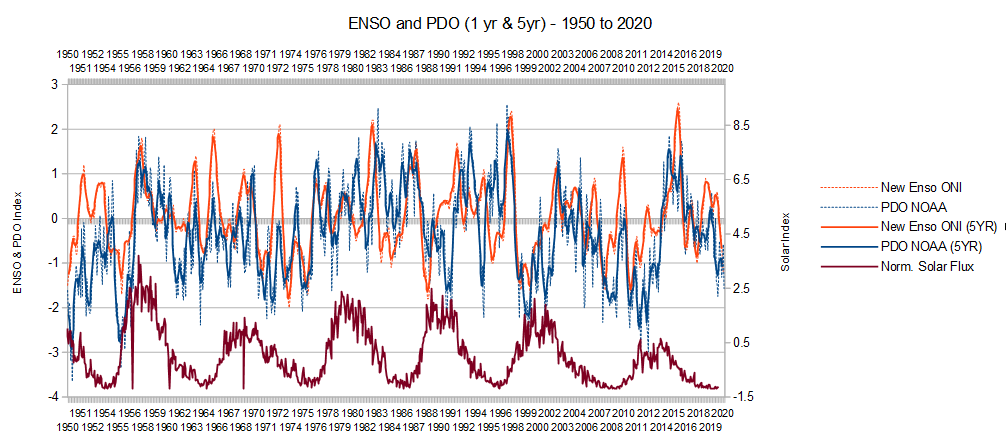
|
|
|
|
Post by sigurdur on Dec 19, 2020 0:47:52 GMT
|
|
|
|
Post by missouriboy on Dec 19, 2020 18:20:20 GMT
Western Pacific Warm Pool, ENSO and PDO with Comparisons to Solar Cycles and the AMOCHART 1. Western Warm Pool trends warmer from the last low Solar Cycle (SC20) through the beginning of SC24. The 2015-16 ENSO pulse discharged the pool eastward and northward across the Pacific and it has not recharged to previous levels. We would probably (no data) see a similar trend across the first half of the modern warm period, with a drop into Solar Cycle 20. There was a similar Warm Pool discharge in 1973, equivalent in placement to the 2015-16 discharge. CHART 3. Seems that we sometimes treat the AMO as separate from events in the Pacific. But forces that shape Pacific events may carry over to the Atlantic. AMO comparison shows a conjunction of decline with the Pacific that centers on 1973. We are now 9 years past the Pacific Warm Pool Peak of 2011. The coming Atlantic decline is showing up in the main Branch (since 2016) and the northern branch of the Gulf Stream (since 2011). The geographic mixture that is the AMO index should be falling very soon. 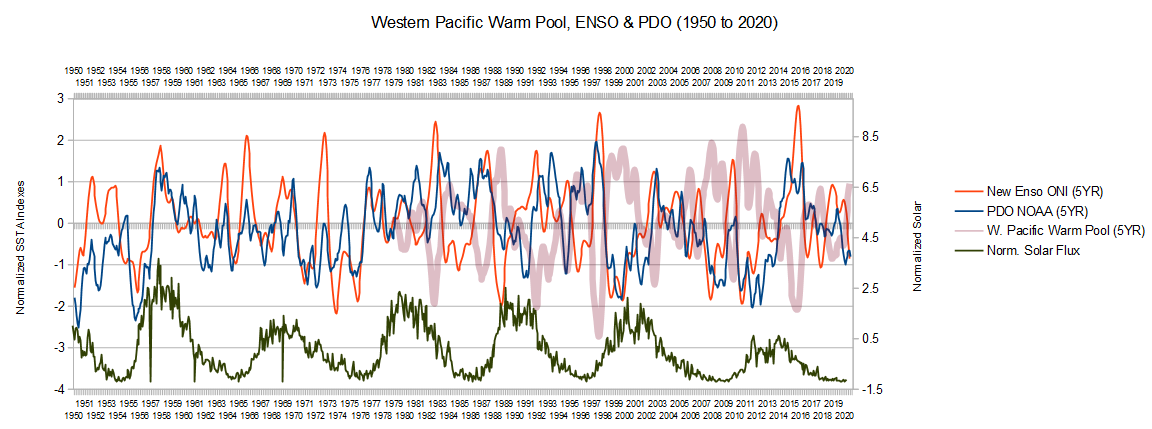 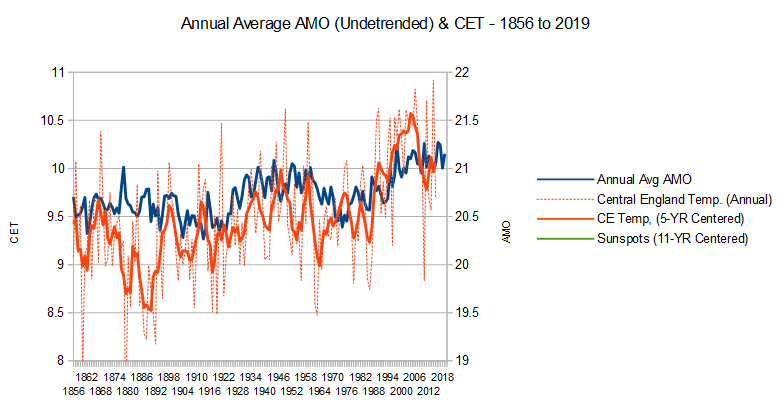 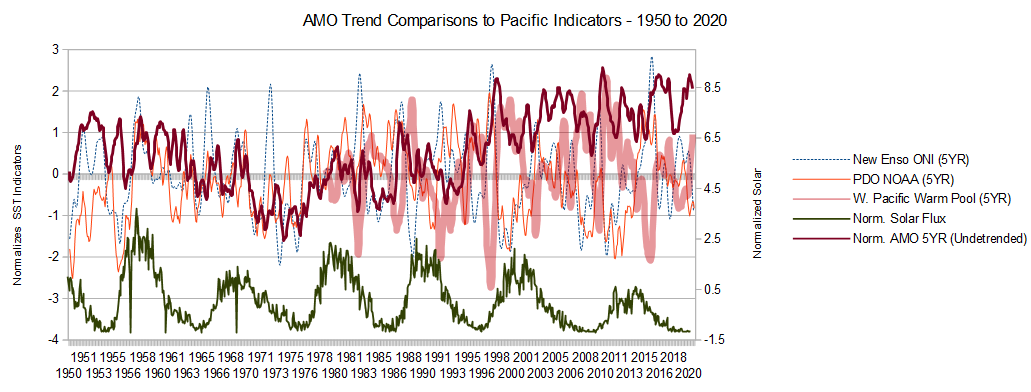
|
|
|
|
Post by nonentropic on Dec 21, 2020 8:20:31 GMT
|
|
|
|
Post by missouriboy on Dec 30, 2020 10:47:58 GMT
Does it not look like our Nina is dropping south of the standard NINO measuring pens? That might make the Nina intensity stats a little off base. Might explain why longpaddock is off to the races while Nino 3 area is not dropping as much. Fixed boxes are so tempermental. Is that a mass of southern hemisphere cold water flowing westward into the warm pool north of the equator? Could that be expected to lower WWP temps? And thus affect the temp. of NH basin-wide outflows over time? earth.nullschool.net/#current/ocean/surface/currents/overlay=sea_surface_temp_anomaly/orthographic=217.84,-10.67,281   |
|
|
|
Post by missouriboy on Jan 3, 2021 22:02:27 GMT
ENSO-Sunspots and UAH Temperature anomalies updated to December, 2020. Bit longer lag this time ... but down she goes. Notice how much lower the sunspot base has been during this last minimum. NEW FORECAST - Today the UAH Regions came out for December. Given that the Tropics declined to 0.05 (anomaly) I am altering my prediction. Tropics to drop to -0.5 with Globe following to -0.25, similar to the pre-SC24 ramp-up at La Nina base. This should occur in the Feb-Mar timeframe. I fully expect to be wrong. But this has been a wrong year, so in that sense I'll be right. 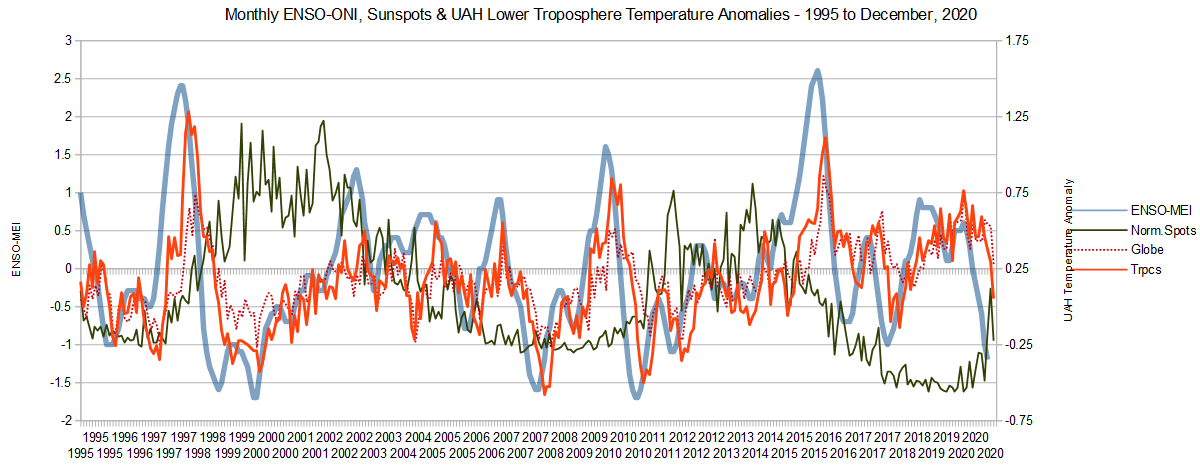 |
|


