|
|
Post by missouriboy on Apr 7, 2021 16:33:16 GMT
End of March, 2021 values are now available for Nino Regions. Chart 1 below shows the track of our current Nina (Regions 1+2 and 3) with the previous two beginning in 1998 and 2010. SSTAs for 2020-21 are tracking colder than 2010-11. Chart 2 below substitutes the 1966-67 Nina for 2010-11. This is the coldest Nina in our records. You will note the huge drop that occurred in the second winter of the 1966-67 sequence. 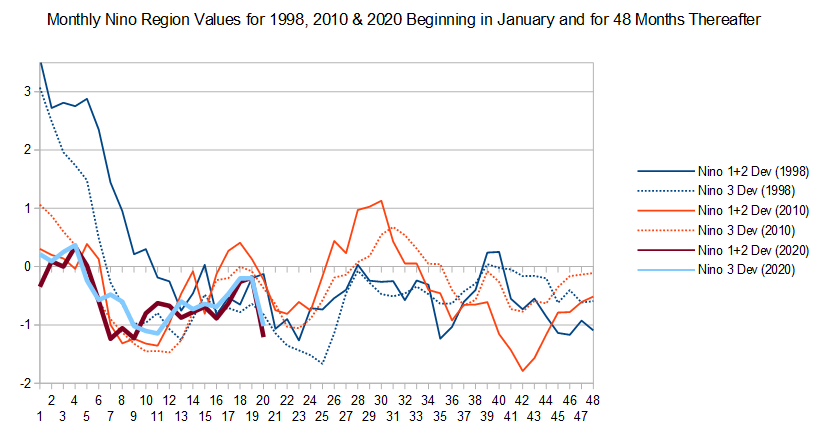  |
|
|
|
Post by sigurdur on Apr 7, 2021 17:01:04 GMT
Not good.
|
|
|
|
Post by neilhamp on Apr 7, 2021 17:58:53 GMT
Thanks for the update Missouriboy.
If Astro is right we should expect to see a similar pattern to 1966
"The answer is that the Fat Lady will be wearing a full-length fur coat.
There's much more to come, and as I've long warned about with this La Nina, it will be with us into 2022"
Start of 2022 is month 25 on Mboy's charts above
|
|
|
|
Post by missouriboy on Apr 7, 2021 18:35:50 GMT
Thanks for the update Missouriboy. If Astro is right we should expect to see a similar pattern to 1966 "The answer is that the Fat Lady will be wearing a full-length fur coat. There's much more to come, and as I've long warned about with this La Nina, it will be with us into 2022" Start of 2022 is month 25 on Mboy's charts above I should qualify. I meant lowest pre-cycle Nina. The actual lowest Ninas occurred following cycle 20 in the 1970-76 time period. |
|
|
|
Post by missouriboy on Apr 8, 2021 23:42:27 GMT
UAH lower troposphere regional temperature anomalies are out for March. The tropics are down to -0.29 C (a decline of almost 1 C since Feb. 2020) versus -0.01 C for the Globe. These continue to fall in sync with ENSO. Next stop 2010-11? 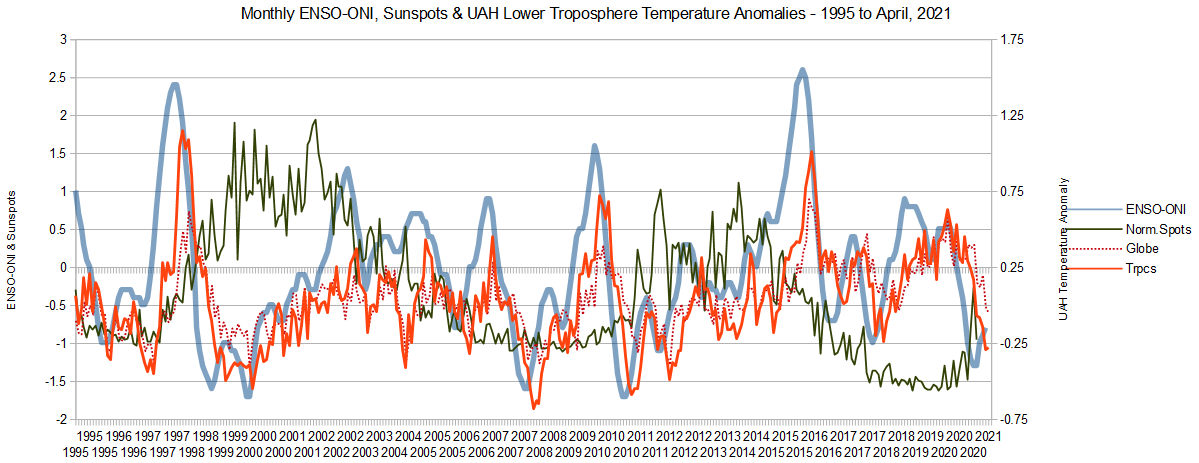 |
|
|
|
Post by missouriboy on Apr 9, 2021 3:04:30 GMT
|
|
|
|
Post by missouriboy on Apr 15, 2021 17:55:42 GMT
ACID. I was looking at peikko's post below that you had on your Twitter page. Was surprised to see a NINA on the Sept. 2019 image. There is no such NINA showing in the SSTA monthly data sets for Sept. 2019. Now I can't find the SSTA global maps archive. Any ideas?
|
|
|
|
Post by acidohm on Apr 16, 2021 16:45:53 GMT
ACID. I was looking at peikko's post below that you had on your Twitter page. Was surprised to see a NINA on the Sept. 2019 image. There is no such NINA showing in the SSTA monthly data sets for Sept. 2019. Now I can't find the SSTA global maps archive. Any ideas? Not off-hand, but, if you look at the enso update page, it has ASO at 0.2. Thing is, enso is defined by averaging 3 months so an anomalous pulse can occur but gets smoothed out in overall data, which seems fair enough. I do love it when enso does those blue turbulent patterns, warm pulses are just eastbound blobs, but cold spreading West is turbulence on epic scales and pretty symmetrical. |
|
|
|
Post by missouriboy on Apr 16, 2021 17:59:37 GMT
ACID. I was looking at peikko's post below that you had on your Twitter page. Was surprised to see a NINA on the Sept. 2019 image. There is no such NINA showing in the SSTA monthly data sets for Sept. 2019. Now I can't find the SSTA global maps archive. Any ideas? Not off-hand, but, if you look at the enso update page, it has ASO at 0.2. Thing is, enso is defined by averaging 3 months so an anomalous pulse can occur but gets smoothed out in overall data, which seems fair enough. I do love it when enso does those blue turbulent patterns, warm pulses are just eastbound blobs, but cold spreading West is turbulence on epic scales and pretty symmetrical.Maybe it was the visual strength of the image that threw me off. But I found the minor dip on the pulsing longer-term decline across the ENSO Regions. The two charts below show the temporal monthly and weekly transects from 2015 to current. The September 2019 values are a minor blip on the longer-term decline from the post-cycle ENSO event of 2015 to where we are today. But the imagery was stark. Sure looks like that colder water is getting pumped in from the southeast Pacific, while the north Pacific warm plume is retreating westward from the northwest North American coast, as shown in the increasingly negative PDO values. Where is that northeast Pacific cold plume coming from? I like the phrase, "turbulence on epic scales" ... and it is pulsing symmetrically downward. Those deviations are now at least 2 C colder than they were roughly 6 years ago. With the epic fail of the pre-cycle 25 Nino, I don't think this general trend is going away anytime soon.  As goes ENSO, so go UAH global temperature anomalies. 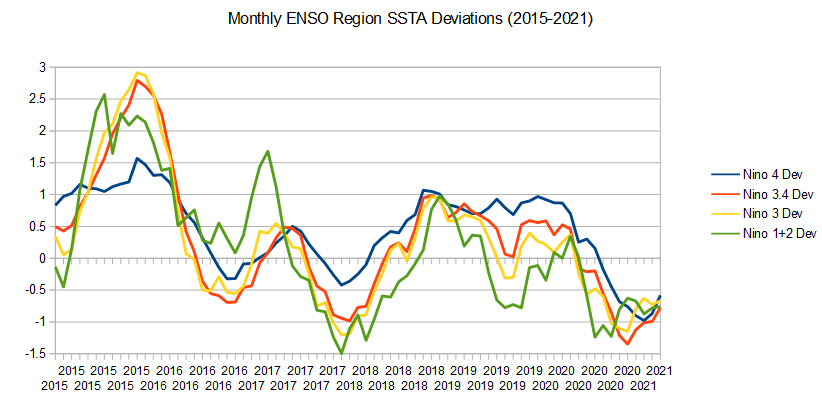 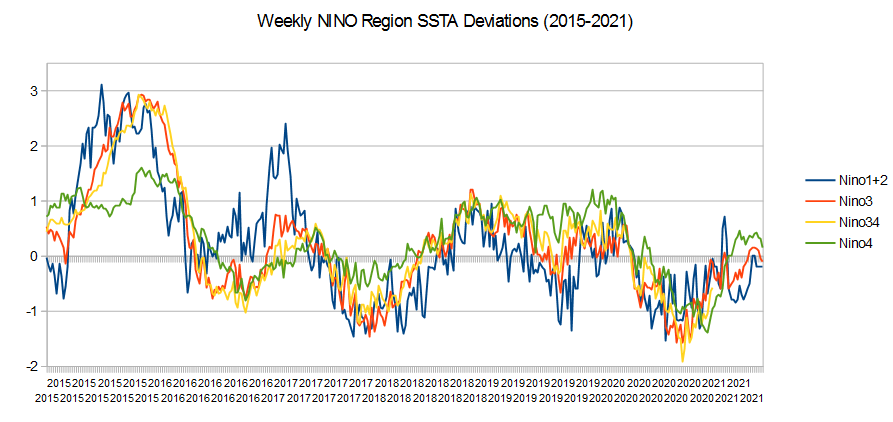  |
|
|
|
Post by sigurdur on Apr 19, 2021 16:37:31 GMT
|
|
|
|
Post by nonentropic on Apr 24, 2021 20:25:33 GMT
Been thinking about how you work out what the climate is doing at any particular moment and we look at the ENSO stuff and the SOI plus other signals and from there come up with ideas as to what will happen in the future, and to quote someone "predictions are tricky, especially about the future". or something.
From the continuous flow of stuff on this site very especially MB and Naut it's clear to me that where the tropical convergent zone is and its consequent rain belt which is fueled by an airflow under the Hadley cell constrained by the divergent zone where dry air descends and moves both ways.
The width of the Hadley cell in my view defines if the climate is in a warm or cold phase. Wide warm, narrow cold. It's the global airconditioning system and Willis E had a graphic on one of his papers (lost to me) that defined the net-zero inward/outward radiation line in the NH and SH unsurprisingly about where the divergent zones were.
Is there any way to aggregate the latitudinal wind's direction and energy so as to track through time the area of the globe between the divergent zones? It may be an indicator of global warming and cooling.
We know that the tropics are temperature stable largely through 20C climate fluctuations from ice ages to hot phases and under the Hadley cells plus a bit for seasonal flux live the happiest of folk on earth, is it getting bigger or smaller.
Not sure if this is clear?
|
|
|
|
Post by nautonnier on Apr 24, 2021 23:15:25 GMT
Been thinking about how you work out what the climate is doing at any particular moment and we look at the ENSO stuff and the SOI plus other signals and from there come up with ideas as to what will happen in the future, and to quote someone "predictions are tricky, especially about the future". or something. From the continuous flow of stuff on this site very especially MB and Naut it's clear to me that where the tropical convergent zone is and its consequent rain belt which is fueled by an airflow under the Hadley cell constrained by the divergent zone where dry air descends and moves both ways. The width of the Hadley cell in my view defines if the climate is in a warm or cold phase. Wide warm, narrow cold. It's the global airconditioning system and Willis E had a graphic on one of his papers (lost to me) that defined the net-zero inward/outward radiation line in the NH and SH unsurprisingly about where the divergent zones were. Is there any way to aggregate the latitudinal wind's direction and energy so as to track through time the area of the globe between the divergent zones? It may be an indicator of global warming and cooling. We know that the tropics are temperature stable largely through 20C climate fluctuations from ice ages to hot phases and under the Hadley cells plus a bit for seasonal flux live the happiest of folk on earth, is it getting bigger or smaller. Not sure if this is clear? Clear to me Non. The Hadley cells are the drivers for the entire system as they are over the main equatorial energy input from Sol  |
|
|
|
Post by nonentropic on Apr 24, 2021 23:35:35 GMT
But how can we track the areal extent?
look during the ice age the Sahara would have been dryer if the Hadley cells became narrower, (this is a question really) and if the world warmed as per the early Holocene or the warmer Emian it should have been wetter???
that is the test in a sense if this is correct. the Sahara gets a monsoon swipe every year or not. the south of the Sahara does currently.
Can we track the area on planet earth between the divergent zones through time and see anything outside of the noise?
|
|
|
|
Post by sigurdur on Apr 25, 2021 0:17:00 GMT
|
|
|
|
Post by sigurdur on Apr 25, 2021 0:17:52 GMT
Thanks for discussing this. A concept I have not thought about, very valid it seems.
|
|


 As goes ENSO, so go UAH global temperature anomalies.