|
|
Post by Ratty on Sept 11, 2020 6:25:12 GMT
Speaking of sea surface temps, what is the best graphic out there?
|
|
|
|
Post by acidohm on Sept 11, 2020 9:53:57 GMT
Speaking of sea surface temps, what is the best graphic out there? Currently prefer TT, I like the 'change in 7 days' graphic and the regional time series at bottom. www.tropicaltidbits.com/analysis/ocean/ |
|
|
|
Post by Ratty on Sept 11, 2020 12:08:26 GMT
Speaking of sea surface temps, what is the best graphic out there? Currently prefer TT, I like the 'change in 7 days' graphic and the regional time series at bottom. www.tropicaltidbits.com/analysis/ocean/Thanks Acid. Exactly what I've been looking for .....  |
|
|
|
Post by acidohm on Sept 12, 2020 9:21:41 GMT
I thought that you liked snow. They aren't necessarily the best at forecasts, so you might consider employing a native to improve the odds.  I do, I thought you said the Nina would be short? I wanted the big one that Astro has been talking about Astro said big nina 21 I think, this current phase may recover to neutral, maybe slightly positive next late spring/summer before falling back late summer/autumn. As you can see here... origin.cpc.ncep.noaa.gov/products/analysis_monitoring/ensostuff/ONI_v5.phpENSO tends to neutralise April may June, its +ve/-ve phases develop/persist through NH winter....mostly |
|
|
|
Post by sigurdur on Sept 12, 2020 21:46:47 GMT
|
|
|
|
Post by missouriboy on Sept 15, 2020 19:08:56 GMT
Those beans look a little "sparse"?
|
|
|
|
Post by sigurdur on Sept 16, 2020 1:25:04 GMT
Those beans look a little "sparse"? Very sparse. |
|
|
|
Post by missouriboy on Sept 23, 2020 19:07:18 GMT
Nino Region 4 seems to be in full collapse mode since September 1 ... and Region 3 is approaching -1.5. 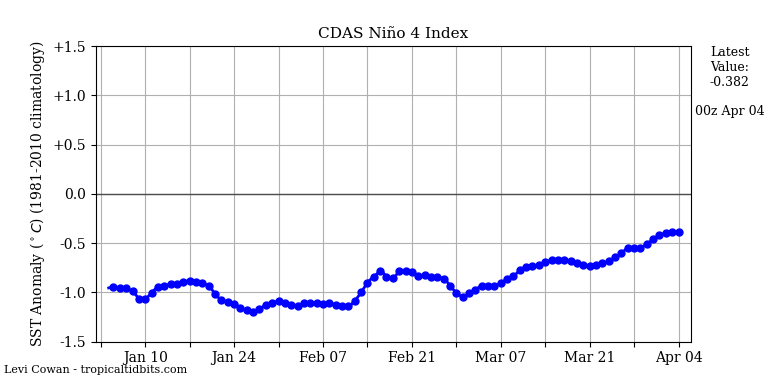 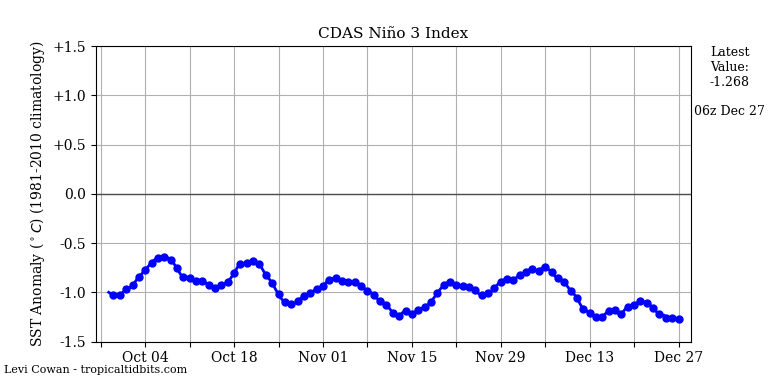 |
|
|
|
Post by acidohm on Sept 28, 2020 8:44:14 GMT
|
|
|
|
Post by nautonnier on Sept 28, 2020 20:58:34 GMT
Things are starting to look a tad chilly, I do feel that the toasty arctic is some kind of invention though as it isn't there in the DMI charts.
|
|
|
|
Post by acidohm on Sept 29, 2020 4:50:57 GMT
Things are starting to look a tad chilly, I do feel that the toasty arctic is some kind of invention though as it isn't there in the DMI charts. I don't understand what "difference from global mean" really represents?? The 7 day graph is a good representation of where temperatures have moved recently, Atlantic is bumbling around average after being warm for a couple of months. |
|
|
|
Post by nautonnier on Oct 17, 2020 21:36:37 GMT
|
|
|
|
Post by acidohm on Oct 17, 2020 22:27:30 GMT
How on earth did you find this Tweet Naut?? Its not really travelled much.... |
|
|
|
Post by acidohm on Oct 17, 2020 22:35:36 GMT
What it looks like he's done is gone here... www.cpc.ncep.noaa.gov/products/CFSv2/CFSv2seasonal.shtmlAnd chosen the coldest of three....and the coldest region. Enso state is declared after 5 consecutive 3months averages being either below or above -5/5°c A sudden dip in one region may be notable, but on the overall table may not be as significant. Of course.....it could become a super la nina, we just don't know yet! |
|
|
|
Post by nonentropic on Oct 18, 2020 3:53:28 GMT
well the temperature predictions on the same site talk about the US and EU having a warm winter, that's different.
|
|


