|
|
Post by missouriboy on Oct 1, 2020 16:54:21 GMT
Precipitation Pattern Changes in the African Sahel: A Geographic Climate Change StudyThe African Sahel appears to be becoming wetter ... at least over the last two or three years. Is this a persistent change in regional climate occurring because of a solar-driven spatial redistribution of pressure patterns which control the movement of moisture-laden monsoon air masses across Africa north of the equator? While David (Adapt 2030) often drifts toward what some would label "the extreme", this is a focused example of a proposed change in the geographic distribution of climate in a specific geographic area (the African Sahel) supported by short term data (last 3 years or so) suggesting a return to a past wetter Sahel climate pattern documented in the archaeological record. This should be an easy thesis to follow and document. Does the new precipitation pattern persist? What are the pressure pattern changes associated with this? What are the links, if any, to solar changes? We don't often get such a distinct example of possible climate change patterns. This should be fun!  This is the link to the latest Adapt 2030 video. There are several others. www.youtube.com/watch?v=sXFF9fd4p4c Adapt 2030 at ... www.youtube.com/c/Adapt2030/videos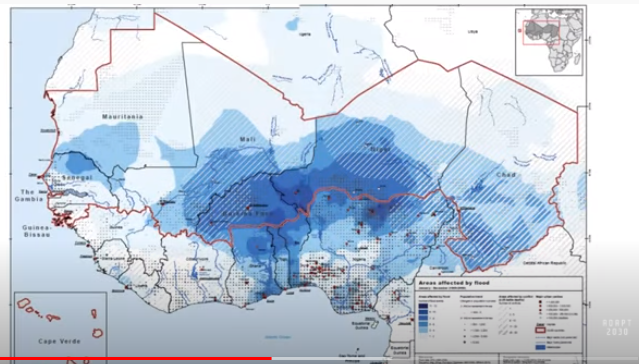
|
|
|
|
Post by nautonnier on Oct 1, 2020 19:30:18 GMT
The changes are definitely happening - as shown by this graphic from WUWT that I reposted earlier on the global warming cooling thread.  The reason for the deserts at the Sahara latitude is always said to be because they are under the downward flowing dry air at the boundary between the Hadley and the Ferrel cells. "As the air leaves the equator, it rains away more moisture, becoming denser and slightly cooler, until finally dry, it sinks, creating the arid bands where many of the world's famous deserts lie. This giant atmospheric conveyor belt, officially called a Hadley cell, brings us both tropical rain forests and deserts."www.britannica.com/video/185630/role-cells-extent-Hadley-rainforests-desertsDiagram 1:  It follows that the only way that the deserts can be greening is that the Hadley cells are not as vigorous which is to be expected with less heating from the Sun. But a search of some of the solar pages seems to show a lack of updating one area that is interesting is the Oulu Neutron count.  Note the high count for the cold 2009/2010 and for the coming year. Interestingly, the diagram from Astomet's post solarcycle24com.proboards.com/post/104511 shows that 2009 is a slightly less extreme version of 2020 from the barycenter (sorry) viewpoint perhaps that has something to do with things.  So we are seeing the convective cells shrink and the weather systems change as the jet streams that form at the boundaries of the cells due to geostrophic and Coriolis effects, become meridional Diagram 2  However, the patterns cease to be nice tidy latitudinal cells as in the Diagrams 1 and 2, and that is borne out by the current jetstream patterns.  The reason for the looping jet streams is supposedly that they are forming Rossby waves as the jets are passing air that is not moving as fast and there is a fluidics effect that causes the Rossby waves to form. That sounds nice and tidy until you see the acute angles where the jets reverse direction. There is obviously something far more chaotic and 4 dimensional going on than the simplistic diagrams would have you believe. What does the team think? |
|
|
|
Post by acidohm on Oct 1, 2020 21:01:33 GMT
I think the atmosphere for Europe is looking interesting..
If this was December (and if it happens... 10 days out...) it is similar to December 2010 pattern.
Long way to go yet, anything could still happen.
|
|
|
|
Post by nonentropic on Oct 1, 2020 22:58:04 GMT
That is the 250hPa Nullschool map.
if you click through the days it does not move much is that normal I don't watch this?
Clearly a LIA can just be largely a thermal redistribution.
Over the years of reading there are accounts of very warm summers in the LIA but clearly every warm stable region has a cold stable region on the other side of the anticyclone.
forgot to send may be jumbled
|
|
|
|
Post by missouriboy on Oct 2, 2020 4:43:03 GMT
|
|
|
|
Post by flearider on Oct 2, 2020 13:17:57 GMT
worst thing is china is already there yrs ahead of anyone else buying up land and building dam's ..
but same in Australia they bought land where they new the rain will come ..
so there people will be fed .. ours not so much ....
|
|
|
|
Post by duwayne on Oct 2, 2020 16:56:41 GMT
The changes are definitely happening - as shown by this graphic from WUWT that I reposted earlier on the global warming cooling thread.  The reason for the deserts at the Sahara latitude is always said to be because they are under the downward flowing dry air at the boundary between the Hadley and the Ferrel cells. "As the air leaves the equator, it rains away more moisture, becoming denser and slightly cooler, until finally dry, it sinks, creating the arid bands where many of the world's famous deserts lie. This giant atmospheric conveyor belt, officially called a Hadley cell, brings us both tropical rain forests and deserts."www.britannica.com/video/185630/role-cells-extent-Hadley-rainforests-desertsDiagram 1:  It follows that the only way that the deserts can be greening is that the Hadley cells are not as vigorous which is to be expected with less heating from the Sun. But a search of some of the solar pages seems to show a lack of updating one area that is interesting is the Oulu Neutron count.  Note the high count for the cold 2009/2010 and for the coming year. Interestingly, the diagram from Astomet's post solarcycle24com.proboards.com/post/104511 shows that 2009 is a slightly less extreme version of 2020 from the barycenter (sorry) viewpoint perhaps that has something to do with things.  So we are seeing the convective cells shrink and the weather systems change as the jet streams that form at the boundaries of the cells due to geostrophic and Coriolis effects, become meridional Diagram 2  However, the patterns cease to be nice tidy latitudinal cells as in the Diagrams 1 and 2, and that is borne out by the current jetstream patterns.  The reason for the looping jet streams is supposedly that they are forming Rossby waves as the jets are passing air that is not moving as fast and there is a fluidics effect that causes the Rossby waves to form. That sounds nice and tidy until you see the acute angles where the jets reverse direction. There is obviously something far more chaotic and 4 dimensional going on than the simplistic diagrams would have you believe. What does the team think? I tend to look at these things closely when someone makes an 11+ year prediction. Is that the case? |
|
|
|
Post by missouriboy on Oct 3, 2020 22:34:05 GMT
OK Duwayne. I'll have a go at that. First the data and an evaluation of the current situation, followed by a generalized prediction. Stephen Wilde lays out a hypothesis regarding solar activity cycles and their effects on Earth's climate systems. I will focus on the Atlantic areas See - www.newclimatemodel.com/new-climate-model/During strong solar cycles, the equatorial Hadley cells are vigorous, resulting in strong sub-tropical high pressure zones north and south of tropics. These zones migrate with the seasonal drift of the sun. In the northern hemisphere summer, high pressure is centered in the Eastern Atlantic and western N. Africa at about 25-30 North. The "textbook" summer climates of Mediterranean Europe and N. Africa are hot and dry. Northern air masses do not generally penetrate the high pressure zone. For the African Sahel, this is the monsoon season. Wet tropical air masses provide most of the annual precipitation, but their northward penetration is blocked by the strength of the sub-tropical high which builds across N. Africa. By January, the sub-tropical high pressure zone has migrated south of the equator. The Sahel is generally dry and the Mediterranean areas receive most of their annual precipitation from strengthened polar air masses. 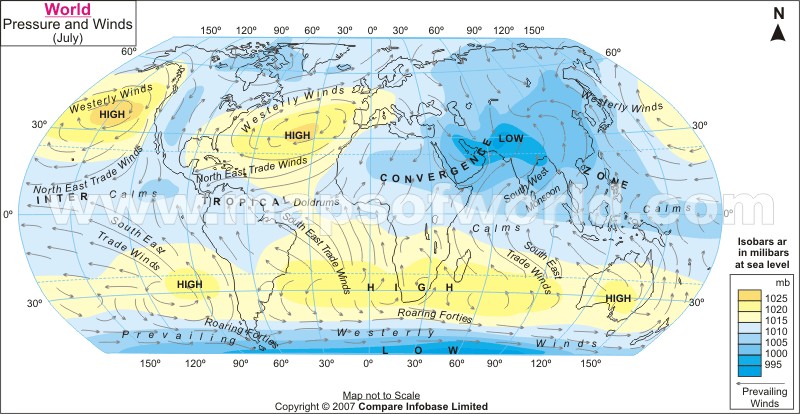 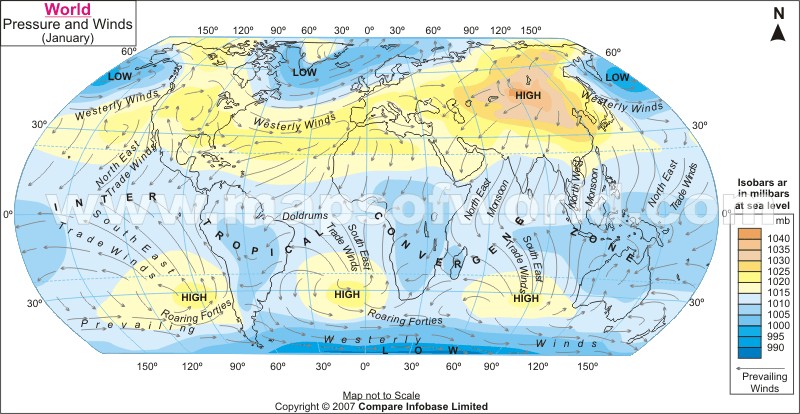 According to Wilde's hypothesis, weak solar cycles should result in weaker Hadley cells and consequently weaker sub-tropical high pressure zones. Polar zones should expand. Monsoons should penetrate further into the African Saheel and polar air masses should penetrate further into those areas bordering the Mediterranean. What do the data show. Fortunately, we have two Eastern Atlantic stations at about 30 N latitude (Gibraltar and Punta del Gada, Azores) with pressure records dating to the 1800s. One of these (Gibraltar) goes back to the end of the Dalton Minimum (1821). The graph below shows the winter and summer pressure trends in moving 5-Year increments. Since 2018, summer pressures at Gibraltar and the Azores have dropped precipitously. They have not been this low since 1821. Winter pressures in the sub-tropics, have tended to drop during low cycles ... SC20 in the 1960s-70s and in the solar minimum transition from SC23 to SC24. We can expect this again in the next couple of years as the current minimum extends into SC25. 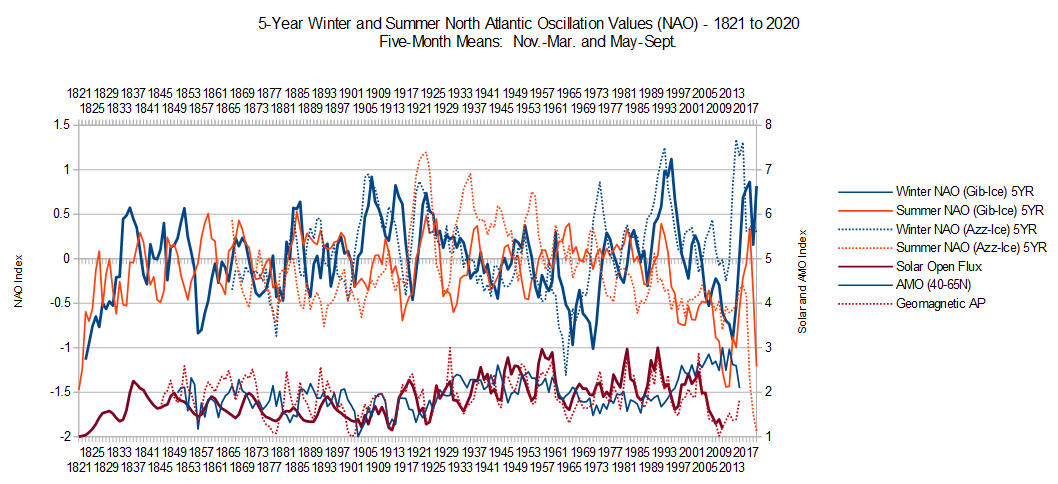 The graph below show pressure pattern trends for Bermuda and the Azores since 1996. During summer, pressure tends to build westward into the Bermuda high. These pressures have also been falling as Azores surface pressure declines. 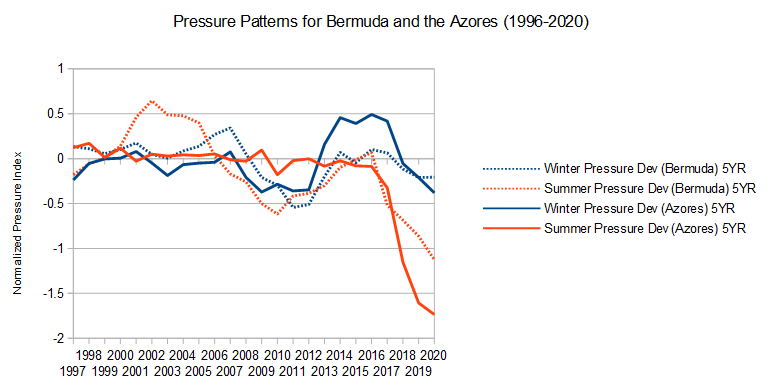 Trends in precipitation across Mediterranean Europe, N. Africa and the Saheel having been increasing dramatically over the last three years. The number and strength of these events have been well covered, if not quantified, by sites such as Watchers news. Meridianal flow seems to have become extreme even in summer, as shown in Naut's postings. We should expect these events to continue, and perhaps worsen in the next couple of years as SC25 starts its run at max. If Solar Cycle 25's ultimate strength is comparable to Solar Cycle 24's, does that mean that weather patterns will return to something comparable to Solar Cycle 24 (the lowest since the Dalton Minimum)? Or, if the oceans are equivalent to a battery that has been charging for the last 100 years, and is now discharging, should we expect a continuing general decline in the thermal energy being released to heat the atmosphere and set the general thermal boundaries of the overall climate system. I tend to trend toward the later. I'll stick with my 1.5 C global temperature decrease over the next cycle ... and we'll see what happens. |
|
|
|
Post by nonentropic on Oct 3, 2020 23:00:35 GMT
1.5C drop is very significant. I sort of hope you are right because it is of such a magnitude that working the measurements will not do it.
If that were to happen we will see excess deaths in the European region that will make Covid look like an entrée.
MB and for the USA or even Ratty and us?
|
|
|
|
Post by missouriboy on Oct 4, 2020 0:16:51 GMT
1.5C drop is very significant. I sort of hope you are right because it is of such a magnitude that working the measurements will not do it. If that were to happen we will see excess deaths in the European region that will make Covid look like an entrée. MB and for the USA or even Ratty and us? I'm a pragmatic prognosticator. I expect to be wrong. Unlike that British chap who seems to think his fecal covid modelings don't stink. And they're good enough for government. Or just what government wanted? If I get close, I'll be pleased ... and it won't have cost the government (or anybody else) a dime. After Thought: Maybe it's kind of like taking Quercetin and Zinc for Covid. I don't know if it worked. I'll likely never know if it worked. But I'm still vertical and not sick. I think I'll declare victory and take the credit.  My hourly consult fee just doubled. |
|
|
|
Post by youngjasper on Oct 4, 2020 0:58:54 GMT
MB, good thoughts. Thanks for sharing. I'll be watching, but this is very interesting!
|
|
|
|
Post by missouriboy on Oct 4, 2020 2:56:35 GMT
MB, good thoughts. Thanks for sharing. I'll be watching, but this is very interesting! Indeed! VERY exciting times. They may kill us. But at least we won't die of boredom.  Go with throttle up. |
|
|
|
Post by nonentropic on Oct 4, 2020 17:49:22 GMT
Is there any long range metric of the Hadley convergence line say over time and is of a resolution fine enough to use it as a climate gauging tool.
The world is sitting calmly for the next winter and the ability to state that cool temperature resilience would be advisable could save millions of lives.
on the other hand building dams in the Sahara could also be a strategy worth some thought.
MB you have used data from 1821 till now yes 200 years is there more out there, its insane that you are doing in your house what the "academic's" should have been pushing through for years.
Satellite data is now 45 years long it should start to generate tight metric's that can be grafted on the long range stuff.
And all that while you had Corona.
|
|
|
|
Post by Ratty on Oct 5, 2020 4:31:49 GMT
Agree. 
|
|
|
|
Post by missouriboy on Oct 5, 2020 4:39:14 GMT
Is there any long range metric of the Hadley convergence line say over time and is of a resolution fine enough to use it as a climate gauging tool. The world is sitting calmly for the next winter and the ability to state that cool temperature resilience would be advisable could save millions of lives. on the other hand building dams in the Sahara could also be a strategy worth some thought. MB you have used data from 1821 till now yes 200 years is there more out there, its insane that you are doing in your house what the "academic's" should have been pushing through for years. Satellite data is now 45 years long it should start to generate tight metric's that can be grafted on the long range stuff. And all that while you had Corona. There are other databases that I have collected and am slowly working up or that I know exist but I don't have. The South Asian Monsoon data goes back to at least 1813, and strong monsoon years appear to be correlated with La Nina years. Chinese records on flooding on the Yangtse and Yellow Rivers go back to the dynasties but I don't have them. Just a plot of major flood years recorded on Wiki show clustering on the rising flank of solar cycles ... likely La Nina related, as we have seen this year. Egyptian Nile river records go back to Pharonic times, and as we have seen this year, floods may also be related to strong La Ninas. It may well be that strong La Nina-related air masses move deeply into East Africa. The IOD shows the cyclic movements of warm waters in the Indian Ocean. We know that periods of low solar activity are dominated by La Nina and periods of strong solar activity are dominated by El Nino. I am sure that there are many papers out there that probe various aspects of such issues. I have certainly not discovered nor read but a fraction. A Chronological Listing of Early Weather Events (James Marusek) is a wonderful source for adding historical meat to the bones of analytical charting. If you mean the inter-tropical convergence zone, then probably only to the beginning of the the satellite era, if systematically mapped. |
|