|
|
Post by nautonnier on Dec 30, 2015 7:19:15 GMT
It is hard to imagine a drop in particle pollution, any gains we have made in the west seem more than offset by new pollution from Asia. But I don't know I think during the heyday of the 50's, 60's and 70's, that the particulate pollution of the west in aggregate is probably higher than China/India today. Noting that the Earth Brightness measurements didn't start showing an increase till the mid 90's, there is potentially a loading lag involved as well? I am not sure that i trust any quantifications that were not in print before the 1970's. There is not a single government agency or university that can be trusted any more. Worse they have been going back and altering previous records (hence the requirement for the values to be in print). I really hope there will be some reckoning for these people that have destroyed the quality of many years of scientific research for their own venal purposes. |
|
|
|
Post by duwayne on Jan 12, 2016 19:37:14 GMT
Here is my year-end 2015 update of the actual results versus my prediction for the 2007 to 2037 period.
Prediction Actual Difference
Average Hadcrut4 Anomaly since 2007 0.5 0.5 0.0
Average RSS Anomaly since 2007 0.3 0.2 -0.1
I expected average ENSO and the PDO readings for 2007-2037 to be similar to the previous cool half-cycle (1947-1977). A year ago the MVENSO and PDO averages were right at the predicted level. With the current mildly strong El Nino, both averages are running above the prediction.
Prediction Actual Difference
Average MVENSO since 2007 -0.3 0.0 0.3
Average PDO since 2007 -0.6 -0.3 0.3
I anticipate that the MVENSO and PDO will drop into negative territory within the next year or so which will begin to bring the observations back in line with predictions. Based on the last cool Ocean Current period a super La Nina is likely within the next several years.
|
|
|
|
Post by maicol72 on Jan 21, 2016 12:19:39 GMT
I post the article I wrote: Anomaly World in December 2015 - shock! For the first time since the beginning of the century (here at the Center Pertini we are very careful and we have every single monthly data stored electronically) a month ago to record a thermal anomaly, of course positive, global (that refers to the entire planet, land + waters) UPPER Celsius degree, exactly +1.11 ° C above the average of the 20th century! Specifically, in December 2015, the Earth's temperature was +13.31 ° C, just 1.11 ° C more than the value adopted as the medium. Let's face it: it is a huge amount! It makes you think and worry. But there is a side that dissolves, at least partially, this concern: in December, it was said a long time, it might have been more influenced by the month that global radiator which was and still is the Nino 2015, an exceptional event, of great power and great durability. In my opinion in January it could also further tweak the thermal anomaly, and maybe (but I stress maybe) even months, but then it should be reduced even more during the remainder of 2016, returning to pre-Nino. At least, we hope so, otherwise really have to get to the bedside of the planet and find a cure convincing! Even the year 2015 obviously broke the all-time record, with the final figure that does mark a thermal anomaly overall positive 0.85 ° C with the temperature of the planet assestatasi to +14.75 ° C. www.ilforumditutti.net/t3919p20-monitoraggio-costante-global-warming |
|
|
|
Post by duwayne on Jan 21, 2016 14:47:07 GMT
I post the article I wrote: Anomaly World in December 2015 - shock! For the first time since the beginning of the century (here at the Center Pertini we are very careful and we have every single monthly data stored electronically) a month ago to record a thermal anomaly, of course positive, global (that refers to the entire planet, land + waters) UPPER Celsius degree, exactly +1.11 ° C above the average of the 20th century! Specifically, in December 2015, the Earth's temperature was +13.31 ° C, just 1.11 ° C more than the value adopted as the medium. Let's face it: it is a huge amount! It makes you think and worry. But there is a side that dissolves, at least partially, this concern: in December, it was said a long time, it might have been more influenced by the month that global radiator which was and still is the Nino 2015, an exceptional event, of great power and great durability. In my opinion in January it could also further tweak the thermal anomaly, and maybe (but I stress maybe) even months, but then it should be reduced even more during the remainder of 2016, returning to pre-Nino. At least, we hope so, otherwise really have to get to the bedside of the planet and find a cure convincing! Even the year 2015 obviously broke the all-time record, with the final figure that does mark a thermal anomaly overall positive 0.85 ° C with the temperature of the planet assestatasi to +14.75 ° C. www.ilforumditutti.net/t3919p20-monitoraggio-costante-global-warmingWhat do you think of the satellite-based anomalies? |
|
|
|
Post by missouriboy on Jan 21, 2016 23:55:18 GMT
While looking through 'William's' old posts in search of geomagnetic stuff, I ran across the following referencing temperature forecasts using solar with respect to Svalbard ... the same as David Archibald references in his book. Might be time to check shortly as to whether these are coming true. Solar activity and Svalbard temperatures The long temperature series at Svalbard (Longyearbyen) show large variations, and a positive trend since its start in 1912. During this period solar activity has increased, as indicated by shorter solar cycles. The temperature at Svalbard is negatively correlated with the length of the solar cycle. The strongest negative correlation is found with lags 10-12 years. The relations between the length of a solar cycle and the mean temperature in the following cycle, is used to model Svalbard annual mean temperature, and seasonal temperature variations. Residuals from the annual and winter models show no autocorrelations on the 5 per cent level, which indicates that no additional parameters are needed to explain the temperature variations with 95 per cent significance. These models show that 60 per cent of the annual and winter temperature variations are explained by solar activity. For the spring, summer and fall temperatures autocorrelations in the residuals exists, and additional variables may contribute to the variations. These models can be applied as forecasting models. We predict an annual mean temperature decrease for Svalbard of 3.5\pm2 oC from solar cycle 23 to solar cycle 24 (2009-20) and a decrease in the winter temperature of \approx6 oC. Paper: arxiv.org/ftp/arxiv/papers/1112/1112.3256.pdf |
|
|
|
Post by sigurdur on Jan 26, 2016 15:23:13 GMT
|
|
|
|
Post by sigurdur on Jan 26, 2016 15:47:43 GMT
|
|
|
|
Post by duwayne on Feb 8, 2016 20:54:11 GMT
Several years ago as the 30-year Ocean Current warm phase was ending, I predicted that the ENSO-driven record satellite-based temperatures of 1998 would not be exceeded for the duration of the 2007-2037 cool Ocean Current phase if the growth in atmospheric
CO2 continued at the then current rate.
The 10-year average CO2 growth rate has increased from 0.43% per year to 0.54% per year. Despite that, the RSS yearly anomaly for 1998 of 0.55C has so far not been exceeded with the highest yearly reading since 1998 being 0.47C in 2010. 2015 was 0.36.
The UAH anomaly was 0.48 for 1998, 0.34 in 2010 and 0.27 for 2015.
2016 could test the 1998 highs. Through January the satellite anomalies are running about 0.1C above the 1998 year record. February could even be a little warmer. We’ll see what happens. Will I have to adjust for the faster CO2 growth?
|
|
|
|
Post by acidohm on Feb 8, 2016 21:07:46 GMT
No! ;-)
|
|
|
|
Post by sigurdur on Feb 8, 2016 22:04:45 GMT
Several years ago as the 30-year Ocean Current warm phase was ending, I predicted that the ENSO-driven record satellite-based temperatures of 1998 would not be exceeded for the duration of the 2007-2037 cool Ocean Current phase if the growth in atmospheric CO2 continued at the then current rate. The 10-year average CO2 growth rate has increased from 0.43% per year to 0.54% per year. Despite that, the RSS yearly anomaly for 1998 of 0.55C has so far not been exceeded with the highest yearly reading since 1998 of 0.47C in 2010. 2015 was 0.36. The UAH anomaly was 0.48 for 1998, 0.34 in 2010 and 0.27 for 2015. 2016 could test the 1998 highs. Through January the satellite anomalies are running about 0.1C above the 1998 year record. February could even be a little warmer. We’ll see what happens. Will I have to adjust for the faster CO2 growth? I don't think you will Duwayne. |
|
|
|
Post by throttleup on Feb 10, 2016 1:48:28 GMT
Several years ago as the 30-year Ocean Current warm phase was ending, I predicted that the ENSO-driven record satellite-based temperatures of 1998 would not be exceeded for the duration of the 2007-2037 cool Ocean Current phase if the growth in atmospheric CO2 continued at the then current rate. The 10-year average CO2 growth rate has increased from 0.43% per year to 0.54% per year. Despite that, the RSS yearly anomaly for 1998 of 0.55C has so far not been exceeded with the highest yearly reading since 1998 being 0.47C in 2010. 2015 was 0.36. The UAH anomaly was 0.48 for 1998, 0.34 in 2010 and 0.27 for 2015. 2016 could test the 1998 highs. Through January the satellite anomalies are running about 0.1C above the 1998 year record. February could even be a little warmer. We’ll see what happens. Will I have to adjust for the faster CO2 growth? Duwayne, Have you factored in the resulting increase in Graywolf posts?  (I love ya, Graywolf! Cheers!) |
|
|
|
Post by duwayne on Feb 10, 2016 17:13:49 GMT
Several years ago as the 30-year Ocean Current warm phase was ending, I predicted that the ENSO-driven record satellite-based temperatures of 1998 would not be exceeded for the duration of the 2007-2037 cool Ocean Current phase if the growth in atmospheric CO2 continued at the then current rate. The 10-year average CO2 growth rate has increased from 0.43% per year to 0.54% per year. Despite that, the RSS yearly anomaly for 1998 of 0.55C has so far not been exceeded with the highest yearly reading since 1998 being 0.47C in 2010. 2015 was 0.36. The UAH anomaly was 0.48 for 1998, 0.34 in 2010 and 0.27 for 2015. 2016 could test the 1998 highs. Through January the satellite anomalies are running about 0.1C above the 1998 year record. February could even be a little warmer. We’ll see what happens. Will I have to adjust for the faster CO2 growth? Duwayne, Have you factored in the resulting increase in Graywolf posts? (I love ya, Graywolf! Cheers!) Throttleup, I'm counting on Graywolf predicting a new record high which will increase the odds of the old records surviving. |
|
|
|
Post by magellan on Feb 11, 2016 2:18:15 GMT
Duwayne, Have you factored in the resulting increase in Graywolf posts? (I love ya, Graywolf! Cheers!) Throttleup, I'm counting on Graywolf predicting a new record high which will increase the odds of the old records surviving. I have been out of the loop on climate stuff for some time now, but this tool is quite telling from Tony Heller (aka Steve Goddard). realclimatescience.com/2016/02/release-1-3/Record minimum temps are being set all over the U.S. A strong Arctic blast is moving in this week throughout most of the country as well. |
|
|
|
Post by magellan on Feb 11, 2016 18:02:29 GMT
I have been out of the loop on climate stuff for some time now, but this tool is quite telling from Tony Heller (aka Steve Goddard). realclimatescience.com/2016/02/release-1-3/Record minimum temps are being set all over the U.S. A strong Arctic blast is moving in this week throughout most of the country as well. Where is the mention of "record minimum temps" being set please? Or did you just assume they are? I realize the question is confrontational but I don't see any mention. I meant to type record minimum temps are being forecast to be set due to a strong Arctic blast moving through this week. It took 3 tries and still got it wrong. I hate cell phones. However, last year there were multiple minimum temp records set in February throughout the U.S., and if UHI affected stations were removed and only rural stations used the real average temperature was very likely much lower than reported. The point about Tony's little app is that reported temperatures are being manipulated being recognition when considering the raw data, particularly at rural stations. The keepers of the SAT records are creating warming trends where none exist. All one need do is look at the daily maximum highs for the last 100 years. I don't assume anything is correct coming out of government controlled temperature reports based on ground stations. |
|
|
|
Post by duwayne on Apr 22, 2016 19:52:18 GMT
In 2007 I surmised that the 60-Year Ocean Current Cycle was entering its Cool Phase and global temperatures would remain flat over the 2007-2037 period despite the warmist warnings that the earth would warm significantly. So far temperatures have been flat. I also predicted that the ENSO (as measured by the Multivariate ENSO technique) and the PDO would be similar to the readings of the last Ocean Current Cool Phase. Nine months ago the MVENSO and PDO readings were right on target. The recent super El Nino has pushed the readings considerably above my predictions. Quarterly Update: 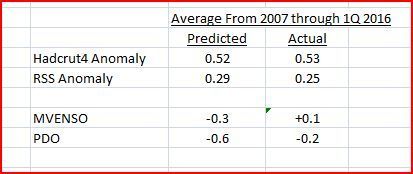 |
|


