|
|
Post by Ratty on Feb 19, 2019 1:39:18 GMT
|
|
|
|
Post by Ratty on Feb 19, 2019 5:10:44 GMT
Here's an excellent (in my opinion) critique of the Paris Climate agreement (COP21). I put this on the "Global warming temperature predictions" thread because its focus is on future temperature predictions, but it is relevant to the discussions on other threads as well. www.emeraldinsight.com/doi/full/10.1108/IJCCSM-05-2017-0107Is this something that Judith Curry or Anthony Watts or Roy Spencer should highlight (or maybe they already have)? This is from the same author and might be of interest to people here who know things: Climate Change 2 - Magnitude of the Greenhouse Effect: |
|
|
|
Post by nautonnier on Feb 19, 2019 11:52:57 GMT
Here's an excellent (in my opinion) critique of the Paris Climate agreement (COP21). I put this on the "Global warming temperature predictions" thread because its focus is on future temperature predictions, but it is relevant to the discussions on other threads as well. www.emeraldinsight.com/doi/full/10.1108/IJCCSM-05-2017-0107Is this something that Judith Curry or Anthony Watts or Roy Spencer should highlight (or maybe they already have)? This is from the same author and might be of interest to people here who know things: Climate Change 2 - Magnitude of the Greenhouse Effect: It is another one of those unicorn filled worlds where the Sun shines continually from directly overhead the entire flat surface and there are no oceans (but magically there are clouds). This is a world much loved by physicists, mathematicians, climate 'scientists' and computer modelers. A virtual world with slab atmosphere that has no convection (but magically there are clouds) and all the surfaces have perfect hohlraum black body emissivity and follow Stefan Boltzmann to the 3rd decimal place.  Meanwhile in the chaotic real world.... where minor value differences in initial states (some factors, their effects and their initial states are not even known), and minor value differences in effects lead to widely divergent outcomes, things are not that simple. Except that from observations and the gas laws we can arrive at the same surface temperatures and wet and dry adiabatic lapse rates without need to resort to a 'green house' effect. |
|
|
|
Post by duwayne on Apr 11, 2019 4:50:02 GMT
Roy Spencer has adjusted the historical UAH anomalies slightly to correct errors caused by satellite orbit drift. I presume that these changes are reflected in the recent monthly update for March. If so, these changes are small. I’ve recalculated my global warming prediction using the latest values using the algorithm I described in 2007. The 2007 trend anomaly still comes out to be 0.2C and based on flat temperatures through 2037, my predicted average UAH global temperature anomaly for 2007 to 2037 remains unchanged at 0.2C.
After the first quarter of 2019, the actual average for 2007 to 2019 (12 1/4 years)is 0.2C.
The 0.2C prediction was based on the condition that atmospheric CO2 concentrations would continue to grow at the then current rate. For the 3-year period prior to 2007 the average growth was at a rate which would cause CO2 to double in 142 years. For the first few years CO2 grew in line with that number, but in the past 3 years the rate has accelerated such that it will take only 120 years to double. If CO2 continues to grow at an accelerated rate, the 0.2C prediction could be exceeded.
|
|
|
|
Post by fatjohn1408 on Apr 12, 2019 10:12:35 GMT
Roy Spencer has adjusted the historical UAH anomalies slightly to correct errors caused by satellite orbit drift. I presume that these changes are reflected in the recent monthly update for March. If so, these changes are small. I’ve recalculated my global warming prediction using the latest values using the algorithm I described in 2007. The 2007 trend anomaly still comes out to be 0.2C and based on flat temperatures through 2037, my predicted average UAH global temperature anomaly for 2007 to 2037 remains unchanged at 0.2C. After the first quarter of 2019, the actual average for 2007 to 2019 (12 1/4 years)is 0.2C. The 0.2C prediction was based on the condition that atmospheric CO2 concentrations would continue to grow at the then current rate. For the 3-year period prior to 2007 the average growth was at a rate which would cause CO2 to double in 142 years. For the first few years CO2 grew in line with that number, but in the past 3 years the rate has accelerated such that it will take only 120 years to double. If CO2 continues to grow at an accelerated rate, the 0.2C prediction could be exceeded. 0.2 degrees - 30 years Doubling - 142 years Does this mean that your assumed climate sensitivity is just above 0.9 degrees? Can you elaborate on why? |
|
|
|
Post by duwayne on Apr 12, 2019 18:08:28 GMT
Roy Spencer has adjusted the historical UAH anomalies slightly to correct errors caused by satellite orbit drift. I presume that these changes are reflected in the recent monthly update for March. If so, these changes are small. I’ve recalculated my global warming prediction using the latest values using the algorithm I described in 2007. The 2007 trend anomaly still comes out to be 0.2C and based on flat temperatures through 2037, my predicted average UAH global temperature anomaly for 2007 to 2037 remains unchanged at 0.2C. After the first quarter of 2019, the actual average for 2007 to 2019 (12 1/4 years)is 0.2C. The 0.2C prediction was based on the condition that atmospheric CO2 concentrations would continue to grow at the then current rate. For the 3-year period prior to 2007 the average growth was at a rate which would cause CO2 to double in 142 years. For the first few years CO2 grew in line with that number, but in the past 3 years the rate has accelerated such that it will take only 120 years to double. If CO2 continues to grow at an accelerated rate, the 0.2C prediction could be exceeded. 0.2 degrees - 30 years Doubling - 142 years Does this mean that your assumed climate sensitivity is just above 0.9 degrees? Can you elaborate on why? Fatjohn, my prediction is that the UAH anomaly will not increase over the 2007 to 2037 period. The 0.2C number is not a temperature increase, it is the average anomaly over the period. The “MaxCon 1.0 Model” thread explains my logic. As to my view on the CO2 climate sensitivity, I believe Judith Curry’s estimates of CO2 climate sensitivity are reasonable and consistent with my global warming predictions. |
|
|
|
Post by Ratty on May 3, 2019 21:28:08 GMT
Sig, who are they? There is very little info available (that I can find)? Code has written to them. I tried but my windows 7 is corrupted. After taxes I will reload windows. In the meantime, Code the floor is yours I finally had a couple of responses from Temperature.Global: Q: Are you able to tell me how you gather your temperature readings? Do you have another site where there is more detail available?
A:
Here is some more info:
www.temperature.global/info.php
We collect most of our data here:
tgftp.nws.noaa.gov/data/observations/metar/cycles/
Q: I think I am correct is saying that all the major datasets rate 2016 as the warmest in the satellite era. You indicate that 2016 is "below normal". Can you elaborate on that for me please? What is your methodology?
A: We simply calculate the mean temperature of all surface weather
observations. We do not use weighted averages or algorithms to fill in
data gaps. That is the primary difference between our calculations and
others. |
|
|
|
Post by nautonnier on May 4, 2019 9:34:31 GMT
Code has written to them. I tried but my windows 7 is corrupted. After taxes I will reload windows. In the meantime, Code the floor is yours I finally had a couple of responses from Temperature.Global: Q: Are you able to tell me how you gather your temperature readings? Do you have another site where there is more detail available?
A:
Here is some more info:
www.temperature.global/info.php
We collect most of our data here:
tgftp.nws.noaa.gov/data/observations/metar/cycles/
Q: I think I am correct is saying that all the major datasets rate 2016 as the warmest in the satellite era. You indicate that 2016 is "below normal". Can you elaborate on that for me please? What is your methodology?
A: We simply calculate the mean temperature of all surface weather
observations. We do not use weighted averages or algorithms to fill in
data gaps. That is the primary difference between our calculations and
others.As you will all know METAR is the METeorological Aerodrome Reports (METARs) ( www.aviationweather.gov/metar) Each of the entries in the table they use starts with the ICAO 4 letter airport identifier so you can identify the airport by decoding that. Airports have their own problems when it comes to being sites for weather observations like huge amounts of concrete runway, taxiway and hardstanding with multiple large kerosene and avgas burning engines scattered about so they have their own microclimate. A claimed peak temperature in London was traceable to the mid-runway automatic observation station and an Airbus 380 landing with reverse thrust then powering up to taxi off the runway. |
|
|
|
Post by icefisher on May 4, 2019 14:07:12 GMT
Code has written to them. I tried but my windows 7 is corrupted. After taxes I will reload windows. In the meantime, Code the floor is yours I finally had a couple of responses from Temperature.Global: Q: Are you able to tell me how you gather your temperature readings? Do you have another site where there is more detail available?
A:
Here is some more info:
www.temperature.global/info.php
We collect most of our data here:
tgftp.nws.noaa.gov/data/observations/metar/cycles/
Q: I think I am correct is saying that all the major datasets rate 2016 as the warmest in the satellite era. You indicate that 2016 is "below normal". Can you elaborate on that for me please? What is your methodology?
A: We simply calculate the mean temperature of all surface weather
observations. We do not use weighted averages or algorithms to fill in
data gaps. That is the primary difference between our calculations and
others.thats a better methodology. Anomalies are used precisely to avoid differences in absolute temperature from location to location. Makes sense to use the raw data for a consistent set of observations (same station, same gear, same environment) if different gear sets are switched out then there should be at that time a validation by running both sets simultaneously as a consistency check. Then your only worry is whether you have a representative set of weather stations. All this homogenizing was really for the purpose of creating climate models and it spawned a whole industry of using it to game the system. |
|
|
|
Post by nautonnier on May 4, 2019 14:27:51 GMT
I finally had a couple of responses from Temperature.Global: Q: Are you able to tell me how you gather your temperature readings? Do you have another site where there is more detail available?
A:
Here is some more info:
www.temperature.global/info.php
We collect most of our data here:
tgftp.nws.noaa.gov/data/observations/metar/cycles/
Q: I think I am correct is saying that all the major datasets rate 2016 as the warmest in the satellite era. You indicate that 2016 is "below normal". Can you elaborate on that for me please? What is your methodology?
A: We simply calculate the mean temperature of all surface weather
observations. We do not use weighted averages or algorithms to fill in
data gaps. That is the primary difference between our calculations and
others. thats a better methodology. Anomalies are used precisely to avoid differences in absolute temperature from location to location. Makes sense to use the raw data for a consistent set of observations (same station, same gear, same environment) if different gear sets are switched out then there should be at that time a validation by running both sets simultaneously as a consistency check. Then your only worry is whether you have a representative set of weather stations. All this homogenizing was really for the purpose of creating climate models and it spawned a whole industry of using it to game the system. I understand the approach but the night time temperatures will be held high (high minimums) as the vast areas of concrete/tarmac and even relatively short grass are like a rocky landscape. This changes the heat profile considerably and with the undergrad 'averaging' of Max Temp and Min Temp, can lead to effects that are hidden in the averaging of means. |
|
|
|
Post by duwayne on May 4, 2019 19:45:03 GMT
In 2007, I suggested there was a 60-year cycle in the ocean currents which provided 30 years of warming push to global temperatures followed by 30 years of cooling effect. I used that plus the overall warming push from CO2 to predict global warming trends.
The AMO is a significant piece of the ocean current effect and I and others have posted graphs of the AMO vs Hadcrut4 anomalies which show the correlation over the 60-year cycles.
I believe the PDO also plays a role, but since its effect is more “choppy”, its effect is less obvious on a decadal basis. But looking at the PDO over the multi-decal 30 year period of 1977-2007 when the AMO was going from its cool minimum to its warm peak, the PDO was also “net warm” with a 30-year average of 0.7. (I’m using the latest updated PDO values that Missouriboy was kind enough to provide a link to.)
My prediction back in 2007 was that the PDO would run cool from 2007-2037 at an amount opposite to the warming effect for 1977-2007. Using the updated PDO numbers my prediction then calls for an average PDO for 2007-2037 of -0.7. So far, using the latest reported PDO values,the average for the PDO for 2007 through April 2019 is right on track at -0.7.
|
|
|
|
Post by douglavers on May 4, 2019 20:38:06 GMT
[[But looking at the PDO over the multi-decal 30 year period of 1977-2007 when the AMO was going from its cool minimum to its warm peak, the PDO was also “net warm” with a 30-year average of 0.7. (I’m using the latest updated PDO values that Missouriboy was kind enough to provide a link to.)]]
I don't know whether it was a co-incidence, but I think 1977 to 2007 also represented a large peak of solar activity. Possibly its most active period in the last 8,000 years.
This has now reversed, co-inciding with The AMO and PDO moving to "cool".
Duwayne, what do you think this will do to global temperatures when the current weak El Nino fades?
|
|
|
|
Post by Ratty on May 5, 2019 0:33:40 GMT
thats a better methodology. Anomalies are used precisely to avoid differences in absolute temperature from location to location. Makes sense to use the raw data for a consistent set of observations (same station, same gear, same environment) if different gear sets are switched out then there should be at that time a validation by running both sets simultaneously as a consistency check. Then your only worry is whether you have a representative set of weather stations. All this homogenizing was really for the purpose of creating climate models and it spawned a whole industry of using it to game the system. I understand the approach but the night time temperatures will be held high (high minimums) as the vast areas of concrete/tarmac and even relatively short grass are like a rocky landscape. This changes the heat profile considerably and with the undergrad 'averaging' of Max Temp and Min Temp, can lead to effects that are hidden in the averaging of means. It would be interesting to know more, eg how many times any one station is polled in 24 hours. HINT: Somebody with a better grasp of methodologies might like to take it up with the TG site? FWIW, they are currently reporting above normal: Current Temperature: 61.17°F (16.21°C) Current Deviation: 3.97°F (2.21°C) above normal12M Avg Temperature: 56.25°F (13.47°C) 12M Avg Deviation: 0.95°F (0.53°C) below normal 2015 average: 0.98 °F (0.54 °C) below normal 2016 average: 0.48 °F (0.27 °C) below normal 2017 average: 0.47 °F (0.26 °C) below normal 2018 average: 1.33 °F (0.74 °C) below normal Stations processed last hour: 60090 Last station processed: Hong Kong, Hong Kong Update time: 2019-05-05 00:31:42 UTC |
|
|
|
Post by missouriboy on May 5, 2019 3:43:07 GMT
The AMO and the PDO are Different Metrics
The AMO is a true temperature metric (whether raw or detrended). The PDO is an ocean temperature distribution metric. When the AMO goes negative it means that surface water temperature anomalies have gone cold relative to the long-term mean. When the PDO goes negative it means that warmer waters are spatially concentrated in the Western Pacific versus the East. It says nothing about what overall North Pacific surface temperature is doing relative to a long term average. It would be useful to have an AMO-equivalent PDO index. DOES the North Pacific Ocean have surface temperature cycles equivalent to the North Atlantic? The PDO does however seem to generally run in sync with ENSO. 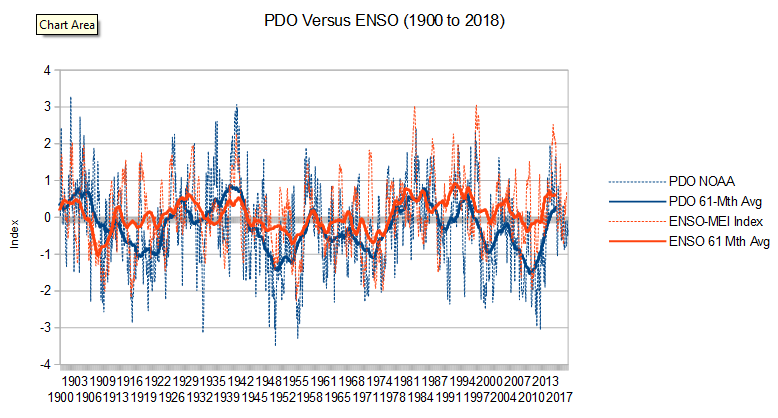
|
|
|
|
Post by blustnmtn on May 5, 2019 11:53:54 GMT
This essay is from JC’s site: judithcurry.com/2019/05/04/rebelling-against-the-extinction-rebellion/#more-24882My take on all of this is that a few with an agenda can always resort to “useful idiots” to propagate their message. In our age it can go global over night, and once started it cannot be stopped because it becomes a business opportunity. The only thing that can stop this now is obvious global cooling and I’m positive that will be attributed to Catastrophic Anthropogenic Climate Change. “We got the +/- a little mixed up in the models but it’s still our fault!” |
|


