|
|
Post by sfbmikey on Feb 11, 2010 18:37:41 GMT
so I noticed that the el nino appears to be dispersing?
not a big ENSO guy, is this the sort of thing that el nino's do? disperse and re-collect? or is this one probly done?
|
|
|
|
Post by jurinko on Feb 11, 2010 23:43:26 GMT
 This one looks it has finished. |
|
|
|
Post by nautonnier on Feb 12, 2010 0:35:07 GMT
It certainly seems to be fading out as does the large hot anomaly between New Zealand and Chile. You can see it fading away in this loop. That is not to say that the Walker circulation is up and running again so we will have to wait and see.  |
|
|
|
Post by neilhamp on Feb 17, 2010 6:45:45 GMT
ENSO wrapup just out
".....climate models suggest that tropical Pacific Ocean temperatures should gradually ease towards neutral values, though are likely to remain above El Niño thresholds into the southern autumn. Models surveyed currently show little to no indication of a reinvigoration of El Niño for 2010. "
|
|
|
|
Post by nautonnier on Feb 26, 2010 0:06:43 GMT
Well El Nino may be fading..... But more interesting look at the Gulf of Mexico -- if the origin of the Gulf Stream is getting so cold - what will that do to the thermohaline circulation? Its engine appears to be stalling. I am told that Florida is getting _another_ frost tonight. |
|
|
|
Post by douglavers on Feb 26, 2010 3:13:47 GMT
Western Europe would have a similar climate to Southern Alaska if the North Atlantic Drift [ misnamed Gulf Stream] was not pouring terawatts of power into the North-Eastern Atlantic.
Looking at Nautonniers graphs, it appears that not only the Gulf of Mexico, but also most of the NAD track is also abnormally cold. It only gets a long way by being less dense.[from warmth].
There appears to be evidence that in ice ages, the NAD faded out [dived] well before reaching Europe.
It is quite noticeable that the recent UK weather has been cold even when dominated by low pressure and Westerlies.
Might be useful study area for the Hadley Centre.
|
|
|
|
Post by nautonnier on Mar 7, 2010 19:17:39 GMT
Interesting take on current El Nino/La Nina from Joe Bastardi of Accuweather...He remains concerned that temperatures are about to crash.... "That Feb, with the el nino spike we had, and the amount of warming in the arctic due to the blocking did not beat 1998 by both the new and old versions of measurements is major. you could not as have stacked the deck more for the warmth. Again, the problem is that with the tendency toward blocking the next 3-5 years because of what I believe the volcanoes did in the arctic areas, and the el nino getting ready to crash as now acknowledged by all models, a big drop in global temps is around the corner. It will be interesting to see if we drop lower than the previous nino responses."<<SNIP>> " In fact, again I forecasted a global spike so being ripped for making the right forecast, has to be something that only someone that simply wants his way. And guess what, in the end, I could be wrong. In the end, we need to find some other energy sources whether I am right or wrong, But that is far different from people who wish to shout down any challenge to their idea. But the way in, if I am right, we are going to need them quicker cause its a pain in the neck to be cold, more people enjoy summer than winter for instance. So it instantly takes away anyones credibility who thinks I am vested in one answer."<<SNIP>> www.accuweather.com/ukie/bastardi-europe-blog.asp?partner=accuweather |
|
|
|
Post by duwayne on Feb 2, 2018 19:45:33 GMT
A paper is not "reality" dude. A paper might be incorrect for example in which case it cannot be reality. Btw here's something I just discovered in an old bookmark which I forgot to review at the time. David Archibald's May 2009 UAH prediction he made in January 2009:  It featured in this thread back in January: solarcycle24com.proboards.com/index.cgi?board=globalwarming&action=display&thread=180&page=25#9144It was on the face of it ridiculous. So ridiculous that layperson as I am I felt and said "My analysis, which is better than Archibald's, is that the recovery will be similar to the one out of the 1999-2000 la nina period." Where I predicted recovery from la nina simply by copying a previous la nina recovery:  Contrast both predictions with what happened: 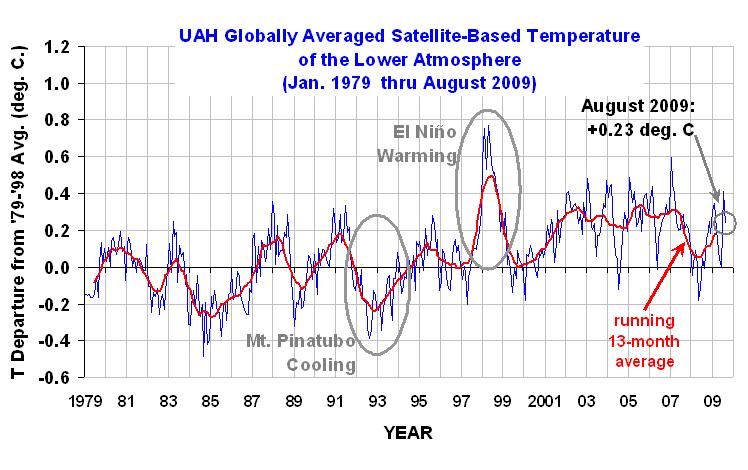 My prediction got the swing above 0.2C by beginning of 2009 correct. It even predicted the weak la nina rebound down to 0C before again it climbing above 0.2C. It didn't predict anomalies would reach above 0.3C though. The details are all uncanny fluke not skillful as all I did was take a previous pattern and append it to the end of the graph. But it does show that solar cycle minimums and neg PDOs are not necessary to explain the general pattern of what happened in the past year. Perhaps rather than a "peak in AGW belief" the past year has heralded instead a "peak in dramatic cooling belief". I imagine people will be a lot more cautious about predicting sudden cooling now. Here's a post from 2009 by Socold with a chart (second one) showing the effect of ENSO. |
|
|
|
Post by nautonnier on Feb 3, 2018 16:42:57 GMT
It may have been dug up - but I see that my graphic further up has been auto-updating Imagine the hyperbole from all the climate alarmists if that cold anomaly in the 'Nino' areas and in the matching area of the mid-Atlantic had been warm instead of cold. It is like the entire equator is going colder apart from a small stretch toward Indonesia. The only hot-spot is the stub of the Gulf Stream but you can see that its origin around Florida is colder too. Why has nobody commented on this? Current state:  |
|
|
|
Post by blustnmtn on Feb 3, 2018 18:03:06 GMT
Why has nobody commented on this? Even a drone might remember that the ocean is supposed to be hiding the heat. |
|
|
|
Post by mondeoman on Feb 3, 2018 18:28:17 GMT
I really do think its going to get cold now....
|
|
|
|
Post by missouriboy on Feb 3, 2018 20:13:40 GMT
We get used to seeing ENSO as a measure of SSTs ... but, if it is also a general measure of oceanic energy being released to the atmosphere (that part that keeps us warm), then how do we interpret this graph? First note the convex shape of the ENSO-MEI index and where the peak occurs. As the peaks of solar flux moves downward, can we interpret the ever-longer elevation of the ENSO index as a cooling system that is shedding heat like crazy. Look at SC20 ... ENSO before and after. That was our last super La Nina if memory serves. Does it look a teeny bit like what is happening now? What is the bottom of this thing going to look like? Big Joe talks about how much heat the ocean needs to shed. Is that what we're seeing now? And ... the UAH lower troposphere temperature deviation for the tropical oceans tracks the ENSO index very closely. 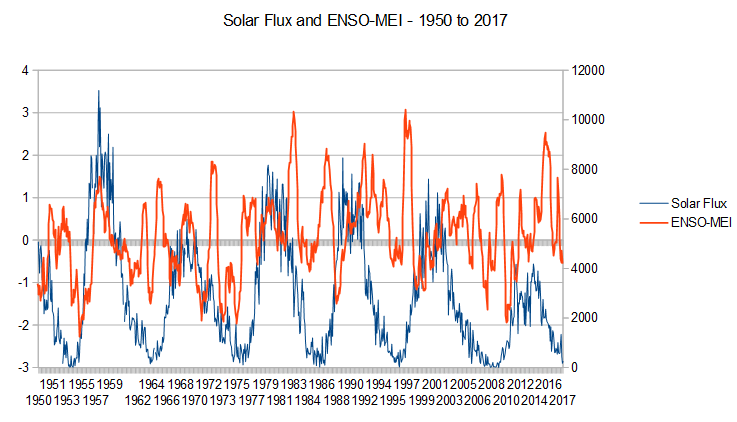 |
|
|
|
Post by Ratty on Feb 3, 2018 22:50:43 GMT
It may have been dug up - but I see that my graphic further up has been auto-updating Imagine the hyperbole from all the climate alarmists if that cold anomaly in the 'Nino' areas and in the matching area of the mid-Atlantic had been warm instead of cold. It is like the entire equator is going colder apart from a small stretch toward Indonesia. The only hot-spot is the stub of the Gulf Stream but you can see that its origin around Florida is colder too. Why has nobody commented on this? Current state: Unisys is off the air again.   Maybe no coral bleaching / dying GBR this SH Summer. |
|
|
|
Post by missouriboy on Feb 4, 2018 3:56:25 GMT
It may have been dug up - but I see that my graphic further up has been auto-updating Imagine the hyperbole from all the climate alarmists if that cold anomaly in the 'Nino' areas and in the matching area of the mid-Atlantic had been warm instead of cold. It is like the entire equator is going colder apart from a small stretch toward Indonesia. The only hot-spot is the stub of the Gulf Stream but you can see that its origin around Florida is colder too. Why has nobody commented on this? Current state: JANUARY 2011 was similar but had reached its greatest visual extent (but peak of -1.9 was in Sept. 2010). Smaller El Nino than 1997 but larger La Nina. How far will this one go?  MARCH 2000 (the first image in the archive) was the peak (-1.32) of the 1999-2000 La Nina.   www.climate.gov/news-features/blogs/enso/january-2018-la-ni%C3%B1a-update-summiting-peak www.climate.gov/news-features/blogs/enso/january-2018-la-ni%C3%B1a-update-summiting-peak |
|
|
|
Post by nautonnier on Feb 4, 2018 11:28:17 GMT
That is an interesting selection of graphics. It seems visually, that this year is the only one that the cold SST anomalies are apparent in the Indian ocean as well. Including a significant amount of cold Perth to Madagascar and down to South Africa. Interestingly, it is also reported that South Africa is in a severe drought.
To just call the current pattern a La Nina is understating the geographic extent of the cool SSTs. It is another example the very misleading use of simple Nino boxes and pressure oscillations to define these patterns.
|
|


