|
|
Post by dontgetoutmuch on May 22, 2013 18:51:32 GMT
This is preliminary, but it looks to me like La Nada is starting to wane. And the winner is... La Nina. I'm basing this on a couple of observations.
1. What appears to be a large very cold upwelling on the West coast of South America appears to be real and continuing.
2. A Kelvin wave recently completed it's upwelling cool phase. I expected the warm phase of the wave to bring some heat back into the area, but instead of above average temperatures, the warm phase basically got the temps back to normal. Which is not normal. If the next upwelling phase is normal or stronger, the temps in the area will plunge to well below normal.
Time will tell, but I am starting to think we could be looking at an El Nino this fall. I hope I am wrong.
|
|
|
|
Post by nautonnier on May 22, 2013 21:01:42 GMT
This is preliminary, but it looks to me like La Nada is starting to wane. And the winner is... La Nina. I'm basing this on a couple of observations. 1. What appears to be a large very cold upwelling on the West coast of South America appears to be real and continuing. 2. A Kelvin wave recently completed it's upwelling cool phase. I expected the warm phase of the wave to bring some heat back into the area, but instead of above average temperatures, the warm phase basically got the temps back to normal. Which is not normal. If the next upwelling phase is normal or stronger, the temps in the area will plunge to well below normal. Time will tell, but I am starting to think we could be looking at an El Nino this fall. I hope I am wrong. That could make the back end of the hurricane season more entertaining than I would wish and the 2013/2014 winter rather nasty. |
|
|
|
Post by dontgetoutmuch on May 22, 2013 21:37:30 GMT
I'm going to get my front row seat now. I'll be pulling up chocks from Alaska and moving to Virginia Beach for a couple of years... Can you say Road Trip!!!
|
|
|
|
Post by nautonnier on May 23, 2013 10:54:44 GMT
I'm going to get my front row seat now. I'll be pulling up chocks from Alaska and moving to Virginia Beach for a couple of years... Can you say Road Trip!!! Talk about out of the frying pan...... We appear (according to Joe Bastardi) to be entering an analog of the 1950's as far as weather is concerned due to the Negative PDO. The hurricane forecast for this season and for the following is expected to be similar to that decade.  When I moved to close to the Atlantic in Florida I obtained the sea surge map for cat 5 hurricane to know where not to live. Anywhere on barrier islands or close to the beach is likely to be mandatory evacuation in a storm. The next thing was to ensure that I was in an 'above code' home - all Florida building codes were amended to ensure that the destruction due to Hurricane Andrew would not repeat - includes metal strapping from the concrete float up over the roof and back down to the concrete float the other side. Then ensured that the house was sheltered from the North East quadrant winds so ideally has other houses to the East sheltering it. Get a generator to power the house and a winch to pull fallen trees. Not so much snow in Virginia Beach though  |
|
|
|
Post by icefisher on May 23, 2013 11:53:05 GMT
I'm going to get my front row seat now. I'll be pulling up chocks from Alaska and moving to Virginia Beach for a couple of years... Can you say Road Trip!!! Talk about out of the frying pan...... We appear (according to Joe Bastardi) to be entering an analog of the 1950's as far as weather is concerned due to the Negative PDO. The hurricane forecast for this season and for the following is expected to be similar to that decade. When I moved to close to the Atlantic in Florida I obtained the sea surge map for cat 5 hurricane to know where not to live. Anywhere on barrier islands or close to the beach is likely to be mandatory evacuation in a storm. The next thing was to ensure that I was in an 'above code' home - all Florida building codes were amended to ensure that the destruction due to Hurricane Andrew would not repeat - includes metal strapping from the concrete float up over the roof and back down to the concrete float the other side. Then ensured that the house was sheltered from the North East quadrant winds so ideally has other houses to the East sheltering it. Get a generator to power the house and a winch to pull fallen trees. Not so much snow in Virginia Beach though If its due to global warming we must be back to being as warm as the 1950's |
|
|
|
Post by nautonnier on May 26, 2013 20:41:07 GMT
This anomaly map is interesting seems to show an Atlantic La Nina equivalent from the West coast of Africa.  Certainly looks colder than normal in the Northern Hemisphere Here are the actual SSTs  |
|
|
|
Post by cuttydyer on Jun 6, 2013 12:24:26 GMT
Interesting article from Jo Nova's blog: Can the Moon change our climate? Can tides in the atmosphere solve the mystery of ENSO?The Moon has such a big effect — moving 70% of the matter on the Earth’s surface every day, that it seems like the bleeding obvious to suggest that just maybe, it also affects the air, the wind, and causes atmospheric tides. Yet the climate models assume the effect is zero or close to it.
Indeed, it seems so obvious, it’s a “surely they have studied this before” moment. Though, as you’ll see, the reason lunar effects may have been ignored is not just “lunar-politics” and a lack of funding, but because it’s also seriously complex. Keep your brain engaged…
Ian Wilson and Nikolay Sidorenkov have published a provocative paper, Long-Term Lunar Atmospheric Tides in the Southern Hemisphere. It’s an epic effort of 14,000 words and a gallery of graphs. As these atmospheric tides swirl around the planet they appear to be creating standing waves of abnormal air-pressure that slowly circle the planet, once every 18 years. If this is right, then it could be the key to finally understanding, and one day predicting, the mysterious Pacific ENSO pattern that so affects the global climate. Even at this early stage, brave predictions are on the table — the atmospheric lunar tides should favor the onset of an El Nino either during the summer of 2018-19 or possibly the following southern summer. Wouldn’t it be a major step forward if we could predict the extremes?
Atmospheric tides* might be seeding the El Niños / La Nina pattern
Each summer, there are four stationary high pressure systems in the air at sea level around the Southern Hemisphere. These large regular patterns are spread evenly around the southern half of the planet, spaced at about 90 degrees longitude to each other. Each summer they reform again in roughly the same spot. (See the points marked “H” in Figure 1 below).
 Continued: Link: joannenova.com.au/2013/06/can-the-moon-change-our-climate-can-tides-in-the-atmosphere-solve-the-mystery-of-enso/#more-28328 |
|
|
|
Post by steve on Jun 6, 2013 13:04:11 GMT
cuttydyer,
Looking for correlations can be constructive. But until you know the causation there is very little you can do to model it.
Given the much larger effects of the Sun on the atmosphere (heating rather than tides - though there are tides as well), it would be hard to imagine a role for the tiny effects of the Moon. Does this forecast differ from astromet, who (IIRC) thinks global temperatures peak in 2017 implying El Nino in 2018 is unlikely...?
|
|
|
|
Post by duwayne on Nov 14, 2013 18:02:25 GMT
Several months ago I noted that if the current Ocean Current 30-year cool period were to follow the pattern of the 1947-1977 cycle, then we could see an El Nino developing at the end of 2013 followed by a super La Nina in 2015. A warm Kelvin wave is now underway and it would appear that at least some warming is immediately ahead. 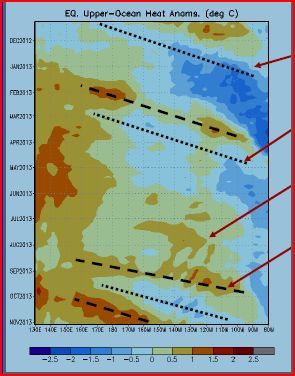 link linkFor those not familiar with the Kelvin wave, temperatures migrate from the western Pacific to the eastern Pacific with the passage of time. In the next few weeks the warm temperatures will likely migrate along the path of the dashed line near the bottom of the chart into the ENSO 3.4 area which is the area where El Ninos are measured. I can imagine the rejoicing of the warmists if a few months of higher anomalies emerge in December and continue into next year. But a super El Nina in 2015 would be a real blow indeed to the warmist cohort enthusiasm. |
|
|
|
Post by sigurdur on Nov 15, 2013 0:38:59 GMT
A month or two of higher anomalies are still within the boundary of the 15 year trend.
After Obama Care......no one is going to believe this bunch which is just fine with me as they wouldn't know the truth if it bit them in the ass.
|
|
|
|
Post by icefisher on Nov 15, 2013 3:31:34 GMT
A month or two of higher anomalies are still within the boundary of the 15 year trend. After Obama Care......no one is going to believe this bunch which is just fine with me as they wouldn't know the truth if it bit them in the ass. That would be true even if it were a blood red 2 to 2.5 wave. This wave is already showing signs of being skinny. Zone 4 appears it may have already topped out and it hit .3 this week. Hardly half way to an El Nino-like sea state much less the kind of staying power needed to result in an official El Nino. ENSO Models are near universal in predicting ENSO 3.4 will top out next month so an El Nino before the end of the year seems unlikely. ENSO Models still insist an El Nino is coming having had one quite consistently out 4 to 9 months now for going on 3 years but they have typically been considerably more accurate on shorter time scales. I don't think we can go by the 50's through 70's for ENSO. While it seems likely we are in a similar ocean oscillation phase but we don't have anything like the solar conditions we had then. If you go back earlier to last couple of decades of the 19th century and first decade of the 20th where solar was similar the ocean oscillation data isn't there. About all we do know is that it was about a degree cooler then and it took a century to get a degree warmer. Bottom line is its now 17 years and counting with no statistically significant global warming, the benchmark that Ben Santer wanted and while solar prediction science is hardly better than a divining stick, it appears its most likely going to get longer because next stop is solar minimum. It seems the really big El Ninos occur about 2 years after solar minimum. 1998 and 2010 followed that pattern. If its solar influenced it could be something related to growing solar activity. I have posted 10 year trend charts that show 10 year trends tend to peak out somewhere around 6 to 7 years after solar minimums. Thus with ocean momentum figured in peak warming might trail the solar awakening with each cycle, beginning to peter out after 4 to 5 years. We are almost 6 years into this cycle and the trend is negative. If thats the peak?  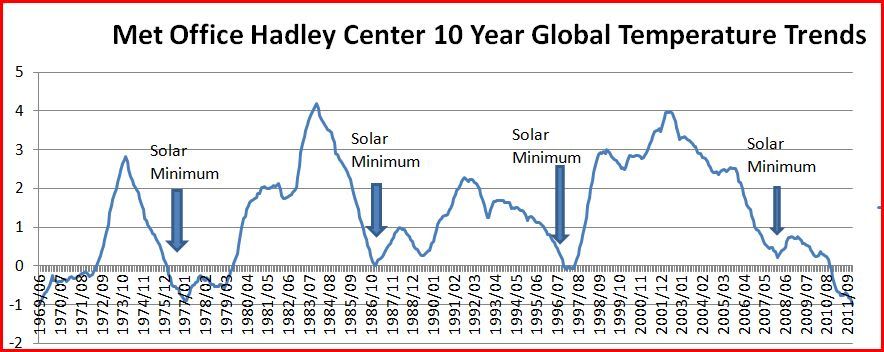 |
|
|
|
Post by sigurdur on Nov 15, 2013 4:29:11 GMT
icefisher:
If that is the peak.......offffffffftttttttttttaaaaaaaaaaaaaaaa.
|
|
|
|
Post by Ratty on Nov 15, 2013 6:30:02 GMT
Stupid question: Does the Moon help drive ocean currents?
Be gentle .....
|
|
|
|
Post by karlox on Nov 15, 2013 7:39:58 GMT
Like this animation where it can be seen how colder waters progresses southward in NH and how real SST can change within a month: SST oct-nov animation |
|
|
|
Post by cuttydyer on Nov 15, 2013 9:38:41 GMT
Like this animation where it can be seen how colder waters progresses southward in NH and how real SST can change within a month: SST oct-nov animationWhat an absorbing animation. The La Nina circulation of cold water coming up from the Antarctica is very apparent - what I haven't seen before is the wave patterns (highlighted in the image below).  |
|