|
|
Post by duwayne on Nov 28, 2014 3:09:31 GMT
Duwayne I have an original article in pdf format. Admittedly it is from 2007, but the science has not changed!! For fun, I have added a CO2/Geologic Eras file. Douglavers, I can't track down either of the above references. Could you cut and paste a few sentences from these references which support your claims as referenced below? "Unfortunately, the first 20 ppm absorbs about half the radiation that CO2 is capable of absorbing. The next 20 ppm absorbs another half, and so on. By the time one reaches 400 ppm, that means that about 99.999% of the radiation that carbon dioxide can ever absorb has already happened." |
|
|
|
Post by duwayne on Nov 25, 2014 22:44:15 GMT
Sigurdur, thanks very much for checking my calculation.
Douglavers, if what you say is true, then the global warming "scare" is over. What can you provide to convince me and others that you are right beyond just declaring that it is so. I have a pretty good understanding of the so-called greenhouse effect so you can make your explanation as technical as you wish.
|
|
|
|
Post by duwayne on Nov 24, 2014 22:19:57 GMT
For those of you with some math expertise.... I'd like some help.
Givens for the purpose of this calculation:
1. Atmospheric CO2 concentration in 1850 was 270 ppm
2. Current CO2 concentration is 400 ppm
3. The global temperature increase from 1850 to current was 0.80C
4. All of the temperature increase was and will be due to CO2
5. The global temperature increase is proportional to the logarithm of the increase in CO2
Question: What will the global temperature be versus 1850 when the atmospheric CO2 concentration reaches 520 ppm?
My calculation is a warming of 1.41C. Is that correct?
|
|
|
|
Post by duwayne on Nov 24, 2014 21:08:13 GMT
I meant to post this in the Global Warming section so I've reposted it there.
For those of you with some math expertise.... I'd like some help.
Givens for the purpose of this calculation:
1. Atmospheric CO2 concentration in 1850 was 270 ppm
2. Current CO2 concentration is 400 ppm
3. The global temperature increase from 1850 to current was 0.80C
4. All of the temperature increase was and will be due to CO2
5. The global temperature increase is proportional to the logarithm of the increase in CO2
Question: What will the global temperature be versus 1850 when the atmospheric CO2 concentration reaches 520 ppm?
My calculation is a warming of 1.41C. Is that correct?
|
|
|
|
Post by duwayne on Nov 6, 2014 14:02:42 GMT
Sigurdur, you and others like me who have farming in their background might enjoy this video (it's a little long)showing how this years grain production went in Canada. They didn't let a little snow stop them at harvest time. link |
|
|
|
Post by duwayne on Nov 4, 2014 15:19:54 GMT
Every 3 months I compare my 2007 Global Warming forecast to the most recent observations. I used the Hadcrut3 data until it was discontinued and replaced by Hadcrut4. Now Hadcrut4 has been replaced by Hadcrut4.3 which I'll still refer to as Hadcrut4. Guess what.....  the historical temperatures have been increased in Hadcut4.3 over those in Hadcrut4.0, but only by a hundreth of a degree or so. Here are the comparisons for the 2007 through the current month averages versus my predicted averages for the 2007 to 2037 period. 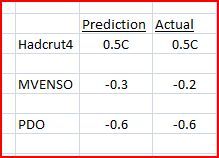 Last quarter my predictions were the same as the actuals. This quarter the MVENSO (multivariate ENSO) is 0.1 higher than predicted as the mini El Nino continues to drag on. |
|
|
|
Post by duwayne on Oct 30, 2014 15:59:42 GMT
From Bishop Hill's Blog.... linkJohn McLean, Professor of Physics at James Cook University in Australia, emails with details of a paper he has just had published in Atmospheric and Climate Sciences about the warming of the planet at the end of the last century. He adds a useful layman's summary. The paper ... - indicates that the temperature pattern can be attributed to a sequence of events, namely a shift in the prevailing ENSO conditions, then a reduction in total cloud cover and then a shift on cloud (decrease in low level cloud that was largely offset by an increase in mid and upper level cloud) - uses the Trenberth, Fasulo & Kiehl energy balance diagram to show that the loss in total cloud cover caused an increase in heat energy being absorbed at the Earth's surface that was greater than the increase that IPCC 5AR claims was due to greenhouse gases - indicates that greenhouse gases played little if any part in the warming, which not only refutes the IPCC's belief or opinion but also means that there is negligible, or even no, 16 or more years' of "missing heat" to be found. - shows the changes in cloud cover and temperature both as global averages and then for the six latitude bands each of 30 degrees, the latter indicating the changes in cloud cover applied to most latitude bands except the Antarctic and to a less extent 30S-60S. - doesn't attempt to identify the reason for the reduction in total cloud cover or the shift from low level cloud. The paper is open access and can be seen here. |
|
|
|
Post by duwayne on Oct 30, 2014 13:14:52 GMT
.......The largest estimate in the scientific literature of the affect of solar activity changes to the so called grand maximum is about 0.1C which is a small fraction of the AGW signature, most actually put the contribution as negative (i.e., we should have a slowly cooling climate since 1957 not a warming one)...... drkstrong, are you saying that the sun does not have a significant effect on global warming? I know there are some scientists that say the small changes in the sun's activity have a profound effect on the earth's weather and temperature. Let me quote one of them. Dr Keith Strong, a solar physicist, says: 'From radio communication disruptions to satellite malfunctions to power outages to weather and climate changes, small variations on the Sun can affect us all in profound ways.' |
|
|
|
Post by duwayne on Oct 27, 2014 14:10:29 GMT
I see the original claim that the Sun is responsible for global warming. As a solar physicist I can say definitively that is not the case because Drkstrong, thanks for your input. You've indicated above without qualification that the sun definitely is not responsible for global warming. Just to be clear, is it your view that none of the warming over the last 75 years (since CO2 began increasing significantly) could be due to the sun? Is it also your view that changes in the sun cannot result in a cooling effect on the earth in the future? |
|
|
|
Post by duwayne on Oct 23, 2014 14:59:36 GMT
The chart below shows sea surface ANOMALIES. Could the Northern Hemisphere sea surface temperatures really be cooling this much versus the historical average for the same dates? Maybe the anomaly is based on the average annual temperature. But if it is, then the Southern Hemisphere is not warming at a comparable rate.  Here's the link. Here's the link. |
|
|
|
Post by duwayne on Oct 7, 2014 13:23:48 GMT
Are the predictions for an El Nino in 2015 out yet?
|
|
|
|
Post by duwayne on Sept 24, 2014 16:46:13 GMT
Neilhamp,thanks for the list. Easterbrook's predictions are impressive in that they are based on a version of the 60-year cycle and they have been accurate. But he is a geologist. Joe, the Actuary's, simple sine wave prediction is far superior to the IPCC's. Where are the climate scientists? |
|
|
|
Post by duwayne on Sept 23, 2014 17:53:45 GMT
Judy Curry's recent presentation to the National Press Club link does a good job of raising questions about CAGW, but think about how much better her arguments would be if she could point to specific past predictions by credible skeptic scientists of the global warming "hiatus". For a long time now I have been asking "Where are the skeptic predictions?". Curry, herself, has co-authored a paper on the "Stadium Wave" which would seem to provide a basis for global temperature predictions, but she seems more interested in focussing on uncertainty than in making forecasts. Meanwhile the CAGW crowd generates forecasts that are wildly wrong but fill the void. Dr. Akasofu wrote a paper link in 2013 with global temperature predictions similar to my 2007 prediction (which so far is on track), but he seems to have generated little in the way of support from the CAGW skeptic community. Scafetta's predictions may be fairly accurate to the extent they are based on a 60-year cycle, but the paper unfortunately is rife with highly controversial solar system calculations which limit its usefulness. We have many decades of temperature data covering the period when CO2 was rapidly rising. Surely this information can be used by skeptic scientists to make a prediction. What's wrong with my prediction? Is it too simplistic for the science community? |
|
|
|
Post by duwayne on Sept 13, 2014 19:34:26 GMT
First off, I don’t pretend to be able to predict El Ninos (or La Ninas). There are lots of discussions about the causes of El Ninos, but the basics seem to be really pretty simple. Warm surface water sloshes eastward along the equator in the Nino3.4 region replacing cooler surface water. This is caused by a slackening and/or reversal of the prevailing easterly winds. The slosh toward the east is magnified if the water in the west has been “stacked up” by previous abnormally strong easterlies. The warmed water in the east can increase upward convection in the east which reduces the windflow toward the west and adds to the eastward slosh. Much has been written about the importance of Kelvin Waves, but as we saw earlier this year, even a very strong Kelvin Wave doesn’t cause an El Nino since it is a subsurface phenomenon. Some would argue that the Kelvin Wave contributes to El Ninos because of the warmed subsurface water and that may be true to some degree, but the Kelvin Wave also reduces the “stacking” of the water in the west which reduces the driving force for surface water to slosh towards the east. Last April I noted the increased atmospheric pressures in the western Pacific pushing the wind to east and the existence of water stacking in the west and the slowing of the easterlies. I expected an El Nino might follow. But almost immediately afterward, the atmospheric pressures changed, the western anomalies subsided and a Kelvin Wave leveled the surface waters. There was some slight warming, but no El Nino. Recently, the driving forces for an El Nino are returning. The atmospheric pressures as measured by the BOM SOI are working to slow the prevailing easterlies. However, I do note that the NOAA equatorial SOI which doesn’t provide daily updates was neutral in August. There is a little water stacked in the west. And the winds have currently died down in the western Pacific as seen on this link . The wind anomalies as shown by the large arrows on the bottom chart below are currently favoring some sloshing of warmer surface water to the east but it is limited because of the minimal water stacking in the west.  I’m not predicting an El Nino since I cannot predict the wind, but for the first time since April there are signs that a small El Nino could be under way. |
|
|
|
Post by duwayne on Sept 4, 2014 12:33:59 GMT
Ratty, Hrizzo, is this chart for global sea ice?
|
|


