|
|
Post by duwayne on May 16, 2014 14:30:50 GMT
To what degree is the ocean height anomaly in the equatorial Pacific a function of windspeed and direction as opposed to water temperature? The article referenced above attributes the change to temperature.
|
|
|
|
Post by duwayne on May 15, 2014 20:45:56 GMT
I review my 7 year old global warming prediction here each quarter, but the Hadcrut3 anomaly still hasn’t been updated for March. It’s clear the Met Office is going to focus their attention on Hadcrut4. So I’ll switch my prediction to Hadcrut4. I’m still going to argue that this is a 7 year old forecast since the methodology is exactly the same as I’ve used for my previous prediction. The method is described in previous posts. solarcycle24com.proboards.com/thread/95/global-warming-temperature-predictions?page=74 My prediction for Hadcrut4 then is that it will remain flat for 2007 to 2037 at 0.51C which is the 2007 trend number based on the 1977-2007 least squares calculation. This compares to 0.47C for the Hadcrut3 anomaly. Through March of 2014 or over 20% of the way through the 2007-2037 period the actual average Hadcrut4 anomaly is 0.46C or 0.05C below the predicted level. Hadcrut3 was 0.06C below the prediction through February. The average MVENSO so far is -0.3 vs the -0.4 prediction. The average PDO is -0.6 which is as predicted. |
|
|
|
Post by duwayne on May 2, 2014 15:27:16 GMT
Icefisher says that the warming off Peru is not caused by positive or warm upwelling and I agree. Here's an animation (if it works) of the recent warming of the waters (not the just the surface water) in the equatorial Pacific which shows the higher temperature anomalies progressing from west to east.  If the animation doesn't work, try going directly to the link here. If the animation still doesn't work, bookmark the link www.cpc.ncep.noaa.gov/products/GODAS/pent_gif/xy/movie.h300.gif and try it later. |
|
|
|
Post by duwayne on May 1, 2014 13:38:10 GMT
Looks like the upwelling along the coast is now positive, so the beginnings of an actual El Nino appear to be happening. Sigurdur, what do you mean by "positive" upwelling? |
|
|
|
Post by duwayne on Apr 20, 2014 16:53:51 GMT
Here are the equatorial SST anomalies from April 9 as shown in the NOAA April 14 update. 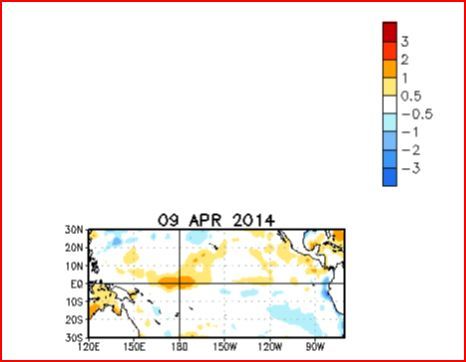 Here are the forecast average equatorial STS anomalies for May-June-July also from the April 14 update (NCEP CFS.v2 Forecast). Note the color coding is a little different. 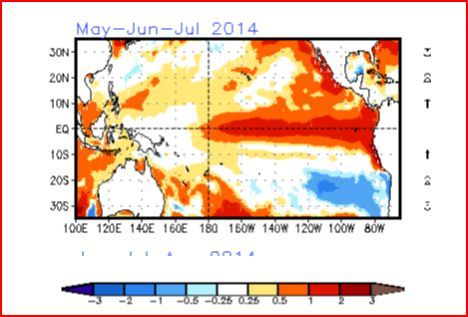 To make this comparison I had to do some cutting and pasting. Is there a site which compares the present vs forecast directly using the same color code? The prediction as I see it is for the surface waters to slosh to the east which will carry warmer water to the South American coast and push water up and down the coast. This will in turn slow the upwelling of cold water because the water is "piled up" higher than normal. The anomalies at 170E will cool and at 150W the anomalies will rise as the water shifts to the east even though the temperature of the "shifted water" may not change. It will be interesting to see how the April 16 equatorial anomalies change from the April 9 chart. |
|
|
|
Post by duwayne on Apr 18, 2014 4:56:28 GMT
This article says "The first official prediction for the peak of Cycle 25 is only seven spots!" Has anyone seen this "official" prediction? The sunspot activity has jumped a lot recently. The SESC sunspot number for April 17 was 296 which would be about 178 on the ISES scale.
|
|
|
|
Post by duwayne on Apr 13, 2014 16:06:36 GMT
Icefisher, thanks for your post above. My focus is on Nino3.4 because of its strong impact on global temperatures. Does your comment #4 apply to the Nino3.4 zone? I've repeated your comment here. "4.How you get multiple degrees of change in water temperature in the east is by slowing or stopping the upwelling and slowing or stop the movement of water to the west. This allows the water that once traveled relatively fast with strong upwelling and easterly trade winds to the west to languish in the equatorial sun for longer periods of time and to be cooled less by very cold upwelling water."
|
|
|
|
Post by duwayne on Apr 13, 2014 15:20:03 GMT
Sigurdur, I'm still interested in your comment that "A full fledged El Nino is fed by warmer water upwelling off the coast of Peru/Ecuador." Are you saying that subsurface water with a temperature higher than the surface water temperature moves to the surface?
|
|
|
|
Post by duwayne on Apr 12, 2014 0:52:24 GMT
Dwayne: A full fledged El Nino is fed by warmer water upwelling of the coast of Peru/Ecuador. The current El Nino is a slosh from west to east, which in the past is indicative of minor El Nino's. It is looking more like this one is going to be a minor one. With that said, I am still hoping for a major one. Timing of the potentially current El Nino is just nut right as well to become a fall presented major warm up of Equatorial waters. Sigurdur, thanks for your reply. I'm with you on a lot of your posts but I have to respectfully disagree with your first sentence and the second part of the second sentence above. I'd be interested in reading anything which confirms your views. |
|
|
|
Post by duwayne on Apr 11, 2014 18:04:50 GMT
Sigurdur, what do you mean by warm upwelling? The water below the surface is colder as you can see from the equatorial ocean temperature (not anomaly) chart I posted above. Icefisher, when you say the Super El Nino of 1997-98 proceeded from east to west, you presumably are referring to the temperature anomalies. But the El Nino results from warmer surface water moving from west to east, the same direction as the Kelvin Wave. The eastern waters warmed more because they normally are colder than those further west . This depiction from Bob Tisdale's post on WUWT shows what happened in 1997-1998.  Do you disagree with this depiction? |
|
|
|
Post by duwayne on Apr 11, 2014 17:15:03 GMT
Svensmark's paper drew a lot of criticism and counterattacks from the warmists, some of it reasonably well thought out. I'd be interested to hear whether this paper draws more of the same.
|
|
|
|
Post by duwayne on Apr 10, 2014 22:33:31 GMT
Icefisher, I’m interested in your view of the approaching El Nino or near El Nino but first I want to repeat some of what you said above but with a focus on the current situation. The charts below show recent equatorial temperatures and temperature anomalies.  At the 160W longitude mark on the upper chart the surface anomaly is zero. On the lower chart the temperature 150 feet below the surface at 160W longitude is about 2C less than the surface. For the next 50 feet down, the temperatures drop by 10C. This is the thermocline where the temperature gradient is around 15 times as great as in the surface waters above and the gradient is many times greater than for the deep water extending downward from 200 feet below the surface. Because water 150 feet below the surface that is 2C cooler than the surface temporarily pushes down about 30 feet into the thermocline and displaces water which is normally 8C cooler than the surface, the anomaly chart shows a +6C anomaly at 150 feet even though the water is 2C cooler than the surface. This downward push of the warmer upper layer of water into the thermocline is the Kelvin wave downwelling. As you’ve pointed out, the lower chart does not show a superheated pool of water lurking just below the surface ready to surge upward as the anomaly chart might first lead one to believe. Then how does the surface water at 160W (within the Nino3.4 zone which stretches from about 120W to 170W) suddenly warm into an El Nino? It can’t warm from colder water below. So the logical cause is that as the Kelvin Wave proceeds east some of the 29C surface and near surface water west of the Nino3.4 area will push eastward and displace some of the slightly cooler 27C surface water. Thus, warming of 3C is possible in the extreme case because that’s approximately the difference between the temperature of the warmest water west of the Nino3.4 area and the current Nino3.4 surface temperature. None of this is news to the ENSO experts. But so far no one seems to have shown the capability to accurately predict the resultant degree of warming even a few months ahead. But now that the Kelvin wave has shown its face and has proceeded well into the Nino3.4 area, shouldn’t it be possible to make a somewhat accurate prediction? What follows is not a prediction, but only a first attempt at a 2-minute “back of the envelop” guess at what might occur without any study of history on my part. I put this out so I can learn from what actually happens and see why the forecasts go wrong. The Kelvin Wave is a strong one so I’ll estimate that a lot of warm surface water will be moved into the Nino3.4 area from the west and it will over time raise the Nino3.4 temperature by one-half the 3C differential in temperature or 1.5C. Then I’ll guess that the Kelvin Wave maintains its current rapid rate of movement through the Nino3.4 zone giving an oscillation length of about 7 months. Kelvin Waves seem to move steadily as shown by the straight line trends in the charts. The monthly anomalies for April through October then might be 0.3, 0.7, 1.1, 1.5, 1.1, 0.7, 0.3 respectively. The seasonal ONI’s for March-April-May (MAM) through SON then would be 0.3, 0,7, 1.1, 1.2, 1.1, 0.7, 0.3 respectively. Icefisher, does any of this make sense in your mind? How are the statistical forecasts prepared? |
|
|
|
Post by duwayne on Apr 4, 2014 17:40:17 GMT
I make it a practice to follow up on my predictions and this perhaps is a good time to check my prediction from a couple of years ago that in the not too distant future the “Climate Scientists” will themselves “discover” the 60-year ocean cycle - the 60-year cycle which is so obvious in the AMO history, the PDO history and in the global temperature history itself – and will dare to project it into the future. I see the article referenced by Graywolf on another thread www.nature.com/news/climate-change-the-case-of-the-missing-heat-1.14525 as a sign of progress toward this prediction. Without acknowledging that the sceptics and luke-warmers were correct, this article indicates that the “Climate Scientists” have finally “discovered” that aerosols were not the cause of the flat global temperatures in the 1947-1977 period and they have finally acknowledged that the models have been very wrong with respect to global warming rates and did not foresee the “hiatus”. Some are finally admitting the possibility that flat temperatures could continue for another 15 years due to the ocean cycle. But so far the “Climate Scientists” are being dragged to the realities of the 60-year cycle after the fact rather than predicting it – at least publicly. But reading between the lines, I think privately many of the more thoughtful “Climate Scientists” now accept the reality of a quasi 60-year cycle. But the “Climate Scientists” as a group may not publicly tout a 60-year ocean cycle until after the next inevitable El Nino and the inevitable La Nina which will follow. After 20+ years of flat temperatures, they will need a good reason why temperatures are going to increase in the future. Surely, the public will have lost faith in the old models and the 60-year cycle will offer the best hope for why global warming will resume. |
|
|
|
Post by duwayne on Mar 29, 2014 15:40:52 GMT
sigurdur, here's the link I use to follow ENSO. It shows the Kelvin wave progressions among other things and is updated once per week. |
|
|
|
Post by duwayne on Mar 16, 2014 15:49:26 GMT
The JAXA historical daily extent data (updated daily) can be found here. I can't find daily historical data tables for Cryosphere. |
|


