|
|
Post by duwayne on Aug 22, 2014 14:45:27 GMT
Hold the presses. I think I've given too much credit to the climate scientists. On further reading I see the authors of the above paper on the 60-year ocean current cycle apparently are an oceanographer and an atmospheric scientist, not climate scientists.
|
|
|
|
Post by duwayne on Aug 22, 2014 13:35:04 GMT
|
|
|
|
Post by duwayne on Aug 12, 2014 14:44:58 GMT
Graywolf, now that your posts incorporate the “hiatus” and the importance of the natural ocean current cycles in the climate process, they make much more sense to me.
My comment… The 60-year cycle was in place before the CO2 growth began. It has continued while CO2 grew rapidly over the past 70+ years. Slight global warming seems to be a questionable basis for predicting the cycles will stop now.
If this cool cycle is very short, won't that mean that the next warm cycle will be short since the ocean current cycles don't create energy?
If the ocean cycles shorten or stop, is it reasonable to expect GHG warming to suddenly accelerate such that the global warming from GHG’s alone equals the rate when the warm cycle was in place? Or does the recognition of the importance of ocean cycles mean that global warming will be much slower than you previously predicted?
|
|
|
|
Post by duwayne on Aug 8, 2014 17:32:32 GMT
It would be great if the underlying cause of the 60-year cycle was known with certainty. But in the meantime climate science should be able to move forward based on the knowledge that there is such a cycle.
Some Climate Scientists are just now belatedly acknowledging publicly that there is a 60-year cycle. I like their choice of words in describing it - an ENSO-like phenomenon with a more regular cycle. Using that desciptor conveys the notion that there is something which significantly affects global temperatures but for which the driving force is not at all understood. This is a big step. Having taken that step, I expect that in the not too distant future we will see something that to my knowledge has not been done. This is something which I have complained about and wondered about for some time.
I predict that we are nearing the point where a respected Climate Scientist (at least respected up to that point in time) will produce a long term global warming forecast which directly encompasses the effects of the 60-year ocean current cycle. To date forecasts built around the 60-year cycle have come from geologists, physicists and even a chemical engineer like myself - people with limited or no credentials in climate science.
If the current El Nino turns out to be a dud, and especially if a super La Nina arises which is a likely event during the Ocean Cycle cool phase,climate scientists will be forced to face reality. But even if there is a moderate El Nino unaccompanied by a major increase in global temperatures I think some climate scientists will begin to emerge from their self-spun cocoons and "discover" reality with respect to the 60-year cycle.
|
|
|
|
Post by duwayne on Aug 8, 2014 13:28:38 GMT
Cuttydyer, thanks for the link to the appinsys 60-year cycle site.
Sigurdur, I agree that the AMO correlates closely with global temperatures, even moreso than the PDO. The advantage of the PDO is that it leads the turns in global temperatures while the AMO is concurrent. In 2007, the PDO turning negative provided evidence that the warm cycle was over. Hence my focus and prediction then was on the PDO although my references were always to the broader ocean cycles including the AMO to substantiate the 60-year cycle pattern.
|
|
|
|
Post by duwayne on Aug 7, 2014 18:40:36 GMT
I predicted some time ago that, as the flat global temperatures continue, the Climate Scientists will be coming around to the view that the climate is significantly driven by the ocean current oscillation - 30 years of cooling followed by 30 years of warming. This prediction would always cause our former poster friend, Steve, to go off on a tirade. This was especially true when Steve couldn't handle the fact that Trenberth had finally "discovered" the 60-year ocean current cycle according to a warmist reporter. Here's a recent quote from an NASA climate scientist concerning the recent "hiatus". "Loeb [NASA scientist] said that changes in solar radiation, water vapor and aerosol particles in the air have likely played a role [in the hiatus], but a major factor may be an El Nino-like pattern of climate variability that has historically coincided with a slowing in global warming. Loeb noted that a rise in global temperatures slowed in the 1940s as the Pacific Decadal Oscillation climate pattern was active – a pattern that similarly lasted 20-30 years." The reporter did not include the obvious additional comment that of course the El Nino type pattern (Oscillation) also likely added a natural boost to the warming in the following 30 years thus causing significant overstating of CO2's effect global warming. The key here is that scientists are admitting the flat temperatures in the 1947-1977 period were not due to aerosols. There never was any science to support the aerosol case. Even Hanssen wrote a couple of years ago that the aerosol science is "extremely uncertain" which is as close as we're going to get to an admission that something else caused the flat temperatures. |
|
|
|
Post by duwayne on Aug 4, 2014 22:34:10 GMT
Here’s an update of my 2007 global warming forecast based on the Hadcrut4 anomalies which the Met Office now seems to prefer. The methodology is exactly as used in 2007 but with Hadcrut4 anomalies substituted for Hadcrut3 in the calculations. So I’ll still refer to this as a 2007 forecast. The focus is on long-term global temperatures in a world where the developing countries continue to advance and, as a result, the world’s CO2 emissions continue to grow rapidly. Rapidly growing atmospheric CO2 isn’t a new thing. Growth began early last century and accelerated in the late 1940’s and from the 1970’s to the present was about 0.5% per year. During that time Mother Earth has provided us with data showing exactly what happens to global temperatures when atmospheric CO2 grows rapidly. This isn’t theory. The results are available. Here are the Hadcrut4 Global Temperature Anomalies from 1850 to 2007. They rose slightly over this period. But the rise isn’t at all smooth.  One can observe the short term ups and downs associated with ENSO and the cooling effects of major volcanic eruptions. And if you look carefully, there is also a clear 60-year cycle. This periodogram shows the strength of this 60-year cycle. By comparison, the effect of the 11-year solar cycle on temperatures is weak.  With 7-year averaging to smooth out the effects of ENSO and volcanoes, we can more clearly see that while CO2 is growing steadily, global temperatures grow in spurts of 30 years followed by 30 year of flat or declining temperatures. Hadcrut 4 smoothed  These global temperature 60-year oscillations closely correlate with the Atlantic Meridional Oscillation (AMO), a measure of ocean current driven temperature fluctuations in the Atlantic Ocean as shown below. The temperature data are detrended to highlight the oscillations. AMO vs Hadcrut4  Likewise, the Pacific Decadal Oscillation shows the same 60-year oscillation. And the ratio of El Ninos to La Ninas also varies in tune with the 60-year cycle. The table below summarizes temperature anomalies and CO2 atmospheric growth. The data are shown for 30-year periods covering the warm and cool Ocean Current oscillations. Remember that these data are not theoretical. They are directly from the perfect model, the Earth. They show what actually happens when CO2 grows rapidly as in the last 60 years. 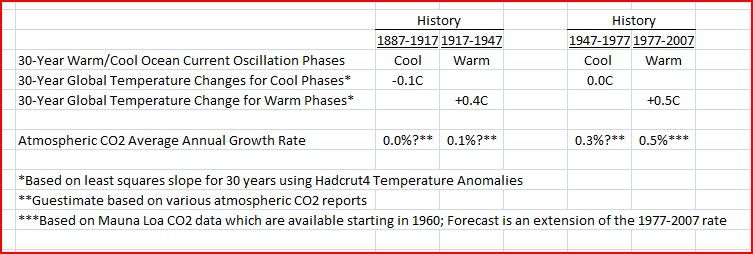 Note that the temperatures for the 2 cool phases are very similar with the later phase showing only 0.1C warming over the earlier period. Likewise the second 30-year warming phase shows only 0.1C more warming despite the substantial difference in CO2 growth rates. The approximately 60-year temperature oscillations appear in proxy data dating back several centuries. Some believe the cycles are driven by the sun, some believe they are driven by the planets and some believe the cycles occur naturally without any oscillating force from the sun and planets. But whatever the reason, they happen. My expectation back in 2007 was that the approximately 60-year ocean current cycle would continue as it has for a long time and the Earth will continue to doggedly follow the rules of physics and remain oblivious to politics, public pressure and the inaccuracies of modelers. If atmospheric CO2 continues to grow at 0.5% per year, we can look to history when atmospheric CO2 grew at 0.5% to see what happens to global temperatures. Here is my forecast from 7 ½ years ago but using Hadcrut4 anomalies. 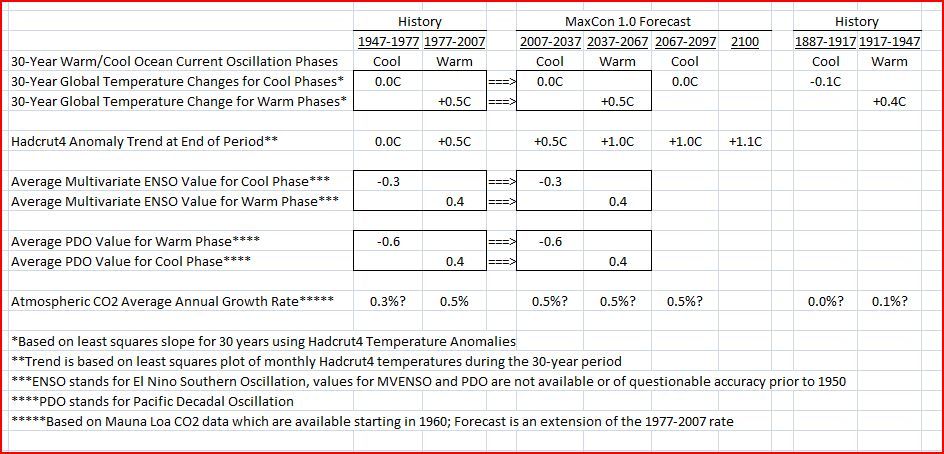 The forecast of flat temperatures for 2007-2037 refers to the multiyear trend. Monthly and yearly global temperatures will, of course, continue to fluctuate with ENSO. And any major volcanic eruption will depress temperatures accordingly. Here is the forecast in chart form. Global Warming Prediction Chart ![]() 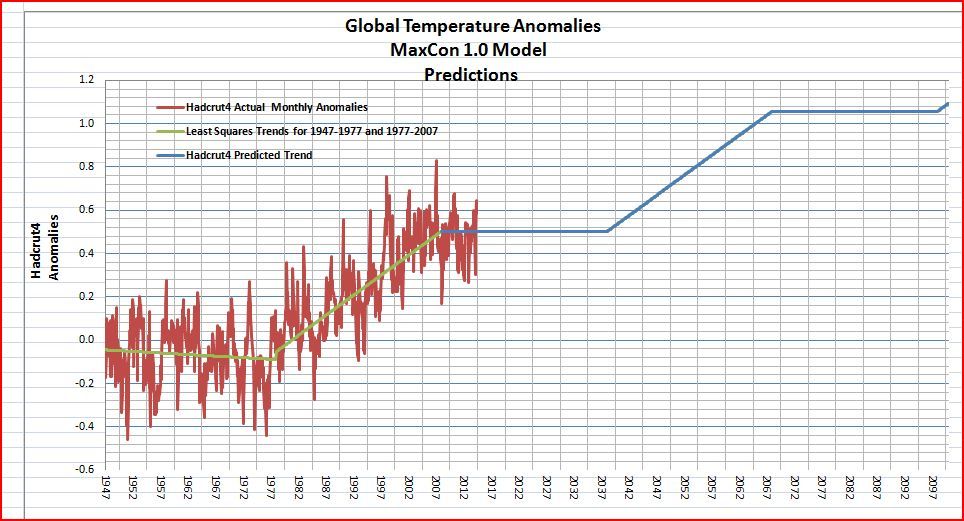 What has happened since the forecast was made in 2007? As predicted, the Ocean Current Cycle, after 30 years in a warm phase has returned to its cool phase. The PDO has turned negative and the AMO appears to have peaked. And as predicted, global temperatures have been flat. Table of Forecast vs Actual 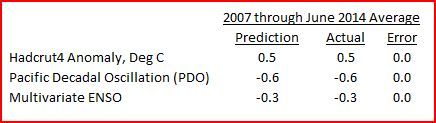 In my view there are 4 things which could render the forecast inaccurate. 1) A long term massive volcanic eruption would mean exceptional cooling. 2) A major change in the rate of CO2 growth could cause more or less long term warming. 3) A large meteor strike could have a major cooling effect. And 4) if the sun should dim significantly over a multidecadal period, the earth will cool accordingly. My model which I labeled MaxCon1.0 works in the real world but, according to some, it doesn’t work in the theoretical world. On the other hand, the global circulation models are good in theory according to their proponents, but they don’t work in the real world. Why would you believe that CO2 has more far more warming power than it’s ever exhibited? Questions and comments are encouraged. I’ll post something later which speaks to some of the questions I’ve received in the past. |
|
|
|
Post by duwayne on Jul 29, 2014 21:28:44 GMT
The Hadcrut4 June anomaly is now available so here’s my quarterly global warming forecast update. This particular update is a milestone in that we are now 25% of the way (7 ½ years) through the cool phase of the 30-year ocean current cycle. First off, let me list my excuses. I only spend a couple of minutes a day on climate stuff. Secondly, I don’t have a degree in climate science. Thirdly, I don’t have government funding. Fourthly, my forecast hasn’t been adjusted in 7 ½ years. And I don’t have access to supercomputers. Here’s my forecast compared to actual. That’s right, all the predictions are on track at this time. In a few days I’ll repost the forecast rationale which I've posted in a slightly different format in the past. |
|
|
|
Post by duwayne on Jul 17, 2014 14:07:32 GMT
ufasuperstorm, that's a great chart. Any chance that you could post the next update when it comes out? Thanks, duwayne
|
|
|
|
Post by duwayne on Jun 15, 2014 13:43:06 GMT
The Joannenova blog is carrying a piece by Dr. David Evans which purportedly will show that the CO2 effects on global warming are far overstated by the warmists and the sun is the major driver of temperatures. Here is a snippet from his first of a series of posts. Guest post by Dr David Evans, 14 June 2014
We’ve been working on this for a year and a half, gradually building up the pieces bit by bit, gradually filling in a picture that is now almost complete. We’ve been bursting to tell the world about it for months, but always noting it would be better if developed and tested before it went public. (How long is a piece of string?) The big danger is that an inadequately explained or prepared alternative explanation of how the climate works will not be given proper consideration, and thereafter will be ignored as “debunked”. There is never a perfect time, but we’ve reached the point where the theory will be tested and developed better by open review. It’s time to set it free…We will be serializing the project as a series of posts, one every day or two. The broad outline of the project, without revealing the major ingredients just yet, is as follows.
We explore some climate datasets and find something interesting, which provides a clue to building up a solar model. We think we have deduced the nature of the indirect solar force that largely influences temperature here on Earth. We get a physical model with physical interpretations (that is, not just curve fitting), working models, and decent fit to observed data.
Both the CO2 model and the new solar model are viable explanations of the global warming of the last century. Any linear mix (e.g. 60% CO2, 40% solar) also fits the observed temperatures. On the performance of the models over the last century, we cannot tell which is correct. However, over the next decade the models predict dramatically different things: the CO2 model of course predicts warming, while the solar model predicts a sharp fall in temperature very soon.
We don’t have to wait to determine whether it is the CO2 or solar model that is more correct. The answer lies in the changes in the height of the water vapor emissions layer, because the influences of CO2 and the indirect solar force are different. From this we are able to determine the cause of global warming and the maximum extent to which the recent global warming was due to CO2. We also clear up a few theoretical befuddlements about the influence of CO2 that may have caused warmists to overestimate the potency of rising CO2.
The fans of the CO2 dominant models are not going to be happy. It seems the climate is an 80-20 sort of thing, where there is a dominant influence responsible for 80% of climate change and a tail of 20% of other factors. It turns out that the CO2 concentration is not the 80% factor, but in the 20% tail. An indirect solar influence seems to be the main factor.On joannenova.com.au scroll down to "BIG NEWS: Part I" to read the first installment.
|
|
|
|
Post by duwayne on Jun 8, 2014 18:18:37 GMT
Every year or so on this board, I restate my global warming forecast using slightly different words and charts. I say “restate” rather than “update” since my basic forecast hasn’t changed since 2007 and, so far, as I show every quarter, it’s been pretty accurate, particularly when compared to the IPCC predictions. But I want to deal with some issues that might concern people about my predictions - the fact that my forecast is pretty simple, the fact that I don’t have a PhD in Climate Science, and the fact that I don’t have a computer model.
Let’s say I wanted to predict how much the hair on my head will grow next year. So I hire a group of prestigious bioscientists to develop a computer simulation model of how food is taken into the body, digested, absorbed into the bloodstream, delivered to the hair follicles and converted into hair. Let’s say the scientists come up with several predictions which range between 12 and 36 inches with a consensus of 24 inches.
Then after 1 year I find my hair has grown only 6 inches. I then have 2 options for forecasting the growth for the following year. Use historical “Pattern Recognition” and forecast the same rate as the previous year or go back to the scientists for another try at “Process Simulation”.
If after a few years, my hair keeps growing at the rate of 6 inches per year and the bioscientists keep predicting a much higher rate, there’s no doubt I would go with the Pattern Recognition method, the method which doesn’t require a sophisticated model or , in fact, any understanding of the underlying process of growing hair.
Fortunately, in the case of global warming we now have 70 years of data showing how global temperatures change while atmospheric carbon dioxide increases at a relatively steady rate. This information, limited somewhat by our ability to measure it, is from the perfect model, the earth itself. Every rule of physics has been followed. No variable has been omitted.
Pattern Recognition requires a careful analysis of the key variables and their effect on the historical results. But it doesn’t require a total synthetic process simulation, or a climate scientist. And, in my opinion, it’s a logical best choice for preparing a global temperature prediction for the case where atmospheric CO2 continues to grow steadily at the historical rate and process simulations are totally inaccurate.
|
|
|
|
Post by duwayne on Jun 8, 2014 15:01:04 GMT
Astro: What do you see the rest of 2014 looking like if you predict 2015 and 2016 to be hot and dry? Will the rest of this year also be hot and dry? I have the solar year 2014 going from cool and wet from the spring, then into a hot and dry summer, and autumn, with not much of a winter of 2015 to speak of Case8930. The winter season coming will be shorter than last winter and certainly nowhere as bad as it was in the northern hemisphere last winter. Spring 2015 will arrive earlier-than-normal and it will be warmer-than-normal as well, going into a hot and dry 2015. that features a 'double summer' next year with very warm temperatures and dry conditions lasting well into autumn 2015, then into 2016. Winter 2016 is late, and also not much of a winter to speak of as well. The Winter of 2017 really takes place starting November 2016, December 2016 and into January 2017. These are the last years of solar-forced global warming, so enjoy them, because as global warming goes out with a bang, so will global cooling come in with a bang in December 2017 and then that will be that. We will be in a new climate regime with the Sun's hibernation cycle that begins a 36-year era of global cooling for the Earth. A La Nina follows with the worst of it during the winter of 2021-2022, setting new records for cold temperature, snowfall and ice. Anyone who bought into the lie of 'man-made global warming' is soon going to have to eat major crow, and for a long time too. At any given time there are portions of the world that are in drought and portions that are much wetter than normal. Currently, California is parched and Washington is wet. Are you able to be more specific in your forecasts with respect to what areas are going to be wet and dry? |
|
|
|
Post by duwayne on Jun 6, 2014 15:06:34 GMT
The websites you provided refer to Ohio’s District 12, so I thought you might live there. The questions I asked, however, apply world-wide. The Chasing Ice story in no way provides a schoolchild with a meaningful perspective on global warming. In fact, it is very misleading if this is the only information provided or if the importance of this vignette is over-emphasized. The idea that you show a student a dramatization of a very, very small segment of the environment and then propose, as the website does, that they use this new found information to advise their congressman on the broad subject of climate science is actually quite appalling. I’ll be interested to hear what actions you take, if any. |
|
|
|
Post by duwayne on Jun 4, 2014 18:34:03 GMT
Code, I believe in AGW and I am skeptical of the climate models. Specifically, I believe the earth will warm by about 0.5C between now and the end of this century and a portion of the increase will be due to CO2. I don’t know whether that meets your criteria for replying to your question but I’ve done so in hopes that it does. From the website info I am guessing that you might be located in central Ohio, so my references below are to Columbus. But they are applicable to other locations as well. The Chasing Ice website focuses on a very, very narrow portion of the climate and then somehow claims this covers the subject to the point that someone is now capable of advising their congressman on the intricacies of climate science. If this were my child, I’d like to see him exposed to the broader aspects of climate science such as: 1. In times past, ice covered the area from Columbus, Ohio to the north pole making it unfit for farming or living. What is the right amount of ice cover? 2. The antarctic sea ice is growing at about the same rate as arctic sea ice is receding. Can this be caused by global warming in both cases? 3. The global temperature increased by about 0.9C from 1850 to 2014. The annual average temperature difference between a town 15 miles north of Columbus and one 15 miles south is also about 0.9C. Which town has the better temperature? Is this difference really significant? How does this compare to the high and low temperature for Columbus on any given day? Or the differences from season to season? 4. How much of the 0.9C temperature increase could be due to carbon dioxide (CO2) when CO2 emissions didn’t start to increase significantly until the 1940’s and temperatures have been flat for the last 15 years while CO2 emissions have continued to increase? 5. Extreme weather events have occurred throughout history. Is it worth noting that the frequency of the extreme events is not increasing?  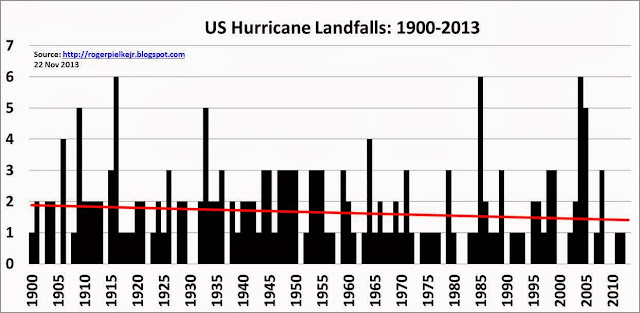  6. Why have the climate scientists grossly over-estimated the rate of global warming? 7. Am I in position to advise my congressman until I can answer these questions and others? 8. Does my school focus me on only a very, very small part of the climate question and pretend that I am educated? |
|
|
|
Post by duwayne on May 21, 2014 15:17:21 GMT
I've been following this guy's weekly videos for a while. He covers a lot to do with wind patterns since the website is about surfing, but at about 13 minutes in he focuses more on Nino. Good detailed info. www.stormsurf.com/video/video_forecast.shtmlVery interesting. While Graywolf is totally stoked about a super El Nino and could be experiencing a wettie warmer, this surfer dude seems to believe those looking for the big wave might experience a wipe out. But anything is still possible. |
|


