|
|
Post by nautonnier on Nov 20, 2016 16:25:01 GMT
The changes in North West Europe weather are linked to the position of the jetstream. The jetstream follows the positioning of the Ferrel cells. If the Hadley cells at the equator are strong due to solar heating then the Ferrel cells move poleward and the jets at the boundary of the Hadley and Ferrel cells become stronger and latitudinal. This leads to the weather repeating - low pressure followed by low pressure every 3 - 5 days another depression. As the Hadley cells cease to be so strong with reduced convection and shrink the Ferrel cells move equatorward and the jets become weaker and more susceptible to forming large Rossby waves and discontinuities and jet streaks. This results in less regular cycle of depressions and omega blocking highs locking the Rossby waves. So weather can also lock in with anticyclonic or cyclonic weather dependent on the position of the meridonal jetstream. Often leading to neighboring areas having different weather as one is on the 'cold' poleward wind side of the jet and the other on the warm equatorward wind side. I think you have been fortunate to arrive at times when it is more anticylonic with southerly winds. Late edit: However, I was asked by some coworkers who were coming on a business trip to Brussels in June - what the weather would be like. I told them it woudl rain - it did.  |
|
|
|
Post by missouriboy on Nov 20, 2016 19:24:42 GMT
Haven't read this yet.
onlinelibrary.wiley.com/doi/10.1029/2001GL013596/pdf
Anomalies in the Seasonal Cycle of Sea Level Pressure in Iceland
and the North Atlantic Oscillation
Abstract. This letter presents an analysis of a new homogenized
time series of daily mean sea level pressure (SLP) from Reykjavik
and Stykkish61mur, Iceland from 1823-1999. Time series
statistical techniques including harmonic analysis are used to
identify the seasonal march of pressure and its variability through
the record. The results are assessed regarding the North Atlantic
Oscillation (NAO) index. In addition to the annual cycle, the
seasonal march of SLP has an appreciable semi-annual cycle, as
well as anomalies (abrupt rises and falls) occurring at remarkably
distinct times in spring and winter. Multidecadal variability is
apparent in the seasonal cycle and the anomalies. A shift in
intraseasonal variability is observed in recent decades, including
an extension of the winter Icelandic Low enhancement period
into March. Increasing failure or delay of the "usual" abrupt
rise in Iceland in late February has contributed to the
unusually positive winter NAO index values since the 1960s.
|
|
|
|
Post by missouriboy on Nov 21, 2016 2:21:04 GMT
Sig. I found that one can download (month by month) daily pressure values (low, mean and high) together with temps for the three stations from Weather Underground ... but only since 1996.
|
|
|
|
Post by missouriboy on Nov 21, 2016 14:32:31 GMT
Missouriboy: I know this asking a lot. CHART 1 can you complete it for all Days? If you used an excel spreadsheet sheet can you send it to me with the modifications? Reason I ask is I want to examine if there is a correlation to start time of the increased/decreased gradients. The area that you are starting to present also has effects on Eurasia. Dr. Curry, with her stadium wave paper showed that to a bit but she didn't extrapolate it as that wasn't a goal in her paper. I would like to compare the pressure changes with the Julian oscillation of the Pacific Ocean as well. Another area that bears some thought is the ocean clients. When the established gradient between good Ole Iceland and Gibraltar is similar to the Long Paddock data. By similar I am stating pressure gradient differences. I am getting a bit more time now to let my mind wander/wonder. SIG ... Will 1996 to 2016 daily pressure data do you any good? |
|
|
|
Post by sigurdur on Nov 21, 2016 16:14:24 GMT
Missouriboy: I know this asking a lot. CHART 1 can you complete it for all Days? If you used an excel spreadsheet sheet can you send it to me with the modifications? Reason I ask is I want to examine if there is a correlation to start time of the increased/decreased gradients. The area that you are starting to present also has effects on Eurasia. Dr. Curry, with her stadium wave paper showed that to a bit but she didn't extrapolate it as that wasn't a goal in her paper. I would like to compare the pressure changes with the Julian oscillation of the Pacific Ocean as well. Another area that bears some thought is the ocean clients. When the established gradient between good Ole Iceland and Gibraltar is similar to the Long Paddock data. By similar I am stating pressure gradient differences. I am getting a bit more time now to let my mind wander/wonder. SIG ... Will 1996 to 2016 daily pressure data do you any good? Probably too short a time frame. If it isn't too much to ask tho, would be interesting to see what it shows |
|
|
|
Post by missouriboy on Nov 29, 2016 22:32:17 GMT
DECADAL TRIANGULATION OF PRESSURE PATTERNS AND THE NAO - 1821 TO 2016
One NASA NAO web page notes the potential problem of evaluating pressure pattern changes based on fixed stations, as they may miss the dynamics that occur over a wider geographic area. Fair enough. But given the lack of long-term data that can bridge cold periods, we have only the recorded observations at Reykjavik, Gibraltar and Ponta Delgada. The former two reach the 'exit ramp' from the Dalton Minimum. The later provides a third point back to 1865 to triangulate pressure pattern changes, as it lies essentially at the same latitude, but 1200 miles west of Gibraltar. There are three graphs below. The later two show normalized sea-surface pressure anomalies/deviations (SSPAs) from an 1864-1983 base period for summer (May-September) and winter (November-March) at each of the three stations. Normalization merely translates the anomalies to a common scale by dividing by the station-specific standard deviation of the base period. Chart 1 shows the resultant summer and winter NAO values, which are the southern station minus Reykjavik, and represent the pressure gradient (positive = strong, negative = weak). Running decadal averages eliminate the noise. These are plotted with solar indices and AMO values for 40-65 N Latitude as extracted from the HADSST3 (supposedly unfilled and unadjusted) data series. In the first post on this thread, I described the 200 year NAO pattern as resembling a plateau with both ends dropping off a cliff. As shown in charts 2 and 3, this happens because southern-station pressures coming out of the Dalton Minimum and dropping into our current period (since ~2000) are lower and the northern station is flat or higher. Thus the north-south Pressure gradient is lower. At all points between the ends, the seasonal NAO gradients are less negative (indicating a higher pressure gradient). Only in the 1960s when, for whatever reason, the pressures at Reykjavik increased dramatically (Chart 2) to their highest values in the whole time series, was the gradient lower than at the ends. Winter patterns (period of greatest gradient) are very similar between the two southern stations. Summer patterns (period of lowest gradient) are quite different in places. Winter NAO values get all the press ... with negative (low gradient) periods being blamed for very cold outbreaks of Arctic air masses during longitudinal flow patterns. I have found little reference in the literature to the effects of summer NAO values on climate, although, as we shall see in the next post, there appears to be a relationship between negative summer NAO values and colder summers in the CET record. The 200 Year Seasonal Trend
The 200 year summer NAO pattern may be described as a convex curve with a singular, positive apex occurring in the 1920-30 period (Chart 1). The rising flank of the Azores-Iceland transect shows a decline from about 1880 to 1910 that may be associated with the the solar minimum centered on 1900. The Gibraltar-Iceland transect shows a similar but less intense decline slightly later. The greatest positive values occur in the same time frame as the first half of the 20th century solar grand maximum and are associated largely with the Azores-Iceland transect, where a large rise in Azores' pressure coupled with a large decline in Iceland pressures (Chart 3) resulted in a very strong summer pressure gradient ... thus a strong positive NAO. This was a period associated with rapidly rising AMO values, which may have affected Reykjavik sea surface pressures. Beyond about 1943, decadal NAO values decline consistently through the mid-1990s and collapse thereafter. The dramatic increase in AMO values since 1990 are not accompanied by lowered pressures in Iceland (unlike the 1920s). Instead, pressures at both southern stations show large declines, accounting for the negative summer NAO trend (Chart 3). There is also no noticeable downturn beyond the general negative trend associated with the solar minimum of the 1960s. The 200 year winter NAO pattern shows the same convex shape (increasing gradient) through about 1915, after which it declines through about 1960 and collapses to a minimum centered on the solar minimum of the 1960s. It rises back to high positive (large gradient) values, peaking in the late 1990s, and has been declining since. Along its rising flank, the trend makes negative excursions in the 1850s and 1870s, but does not replicate the large summer decline focused on the 1900 solar minimum. Chart 2 shows that pressure patterns at Reykjavik and the two southern stations are mirror images of each other in most time periods. Low pressures in Iceland from 1900 to 1940 and 1990 to 2000 are mirrored by high pressure at the southern stations (large positive gradient). Low pressures at the southern stations from 1960 to 1980 are mirrored by very high pressures in Iceland (very low negative gradient). 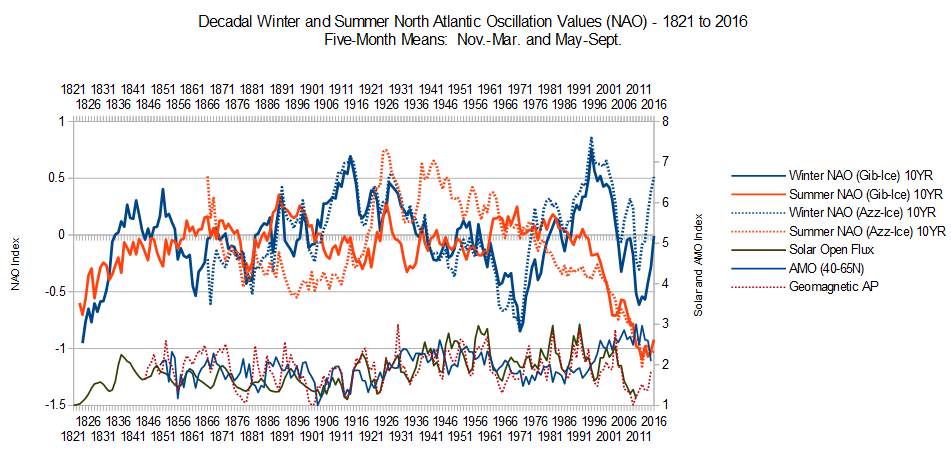 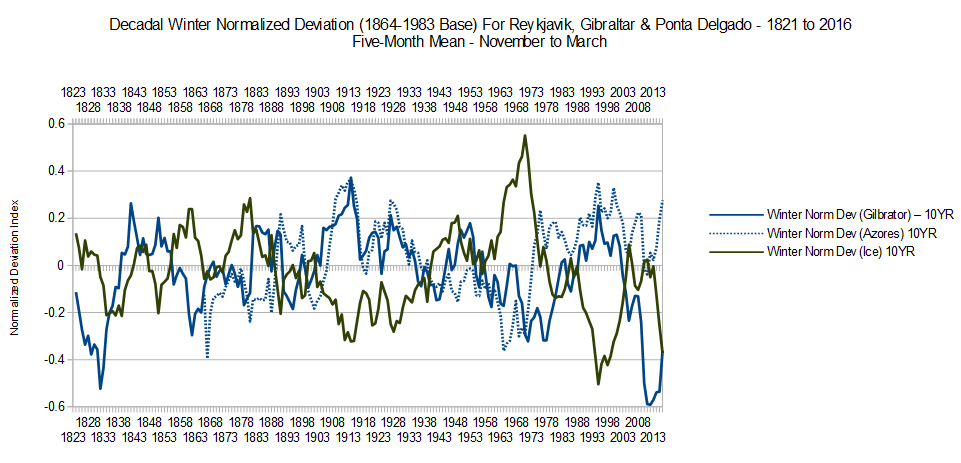 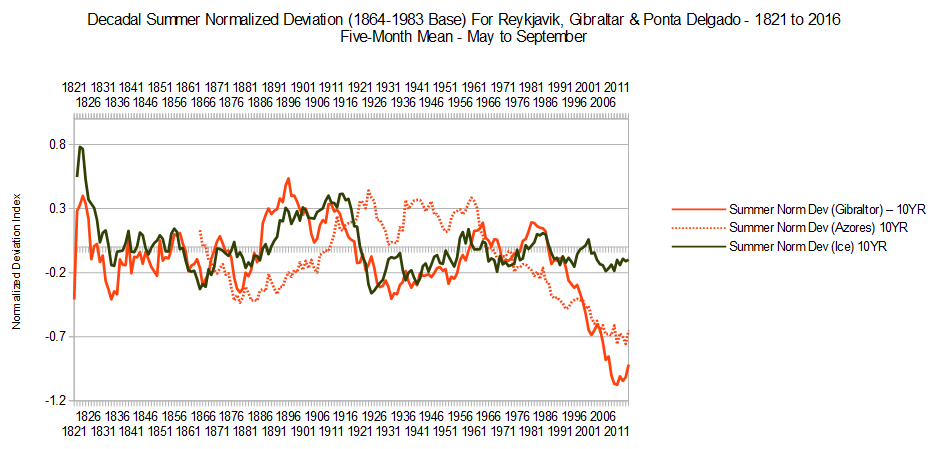 Greenland Blocking Index (GBI) and the North Atlantic Oscillation (NAO) Greenland Blocking Index (GBI) and the North Atlantic Oscillation (NAO)
Charts 4 and 5 below show decadal trends in the GBI and NAO (two transects) differentiated by summer (May-Sept.) and winter (Nov.-Mar.). Paper discussing the GBI and trends is here: opensky.ucar.edu/islandora/object/articles%3A12288/datastream/PDF/viewApparently the GBI and NAO are the yin and the yang of the extended Arctic - N Atlantic Region although no one seems to know which drives which, if at all. Regardless, they are mirrors. A positive GBI is almost always associated with a negative NAO, and the opposite. For now I have one note. Check out the summer (Chart 5) negative Azores-Iceland NAO from 1870 to 1920, and compare it to the number of cold summers (Chart 6) for the same time period. Now look at the summer temperature trend since 2006 in comparison to the very negative summer NAO that has been developing since 1997. So far, the average of these summers have been about 1.5 C higher than the previous period. How far will these summer temperatures drop? 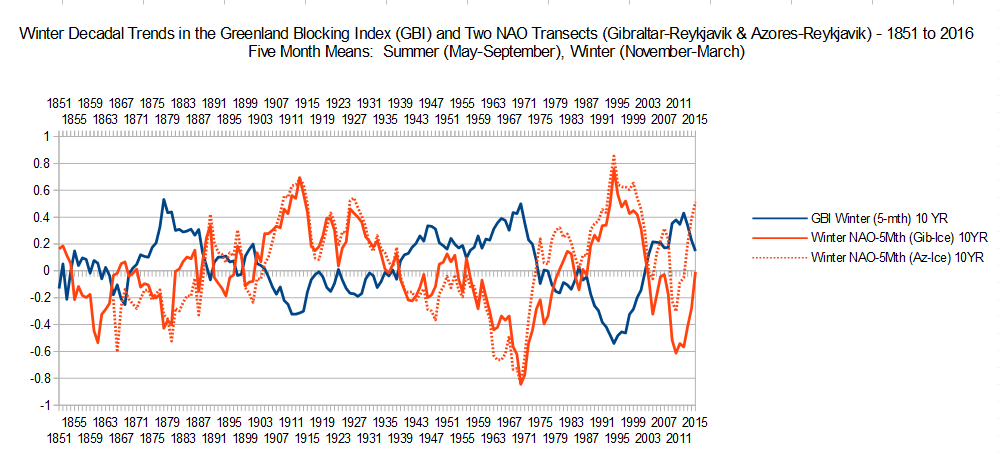 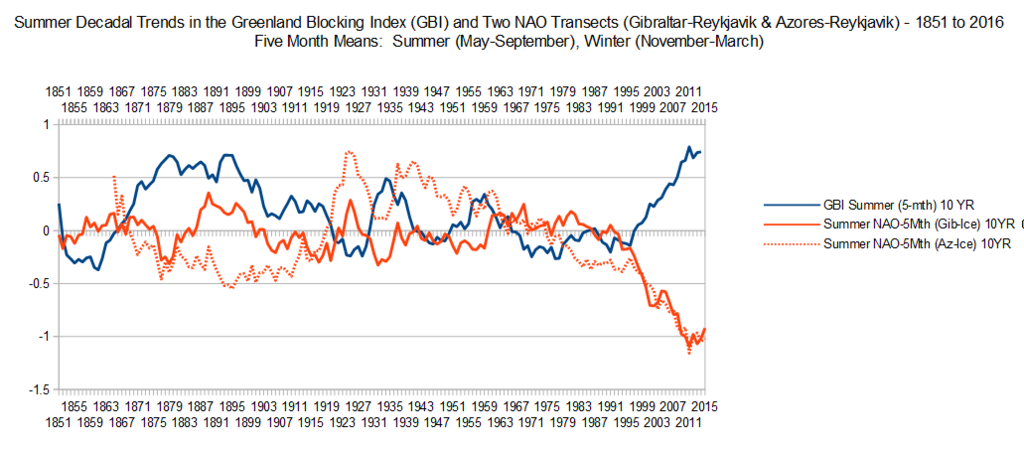 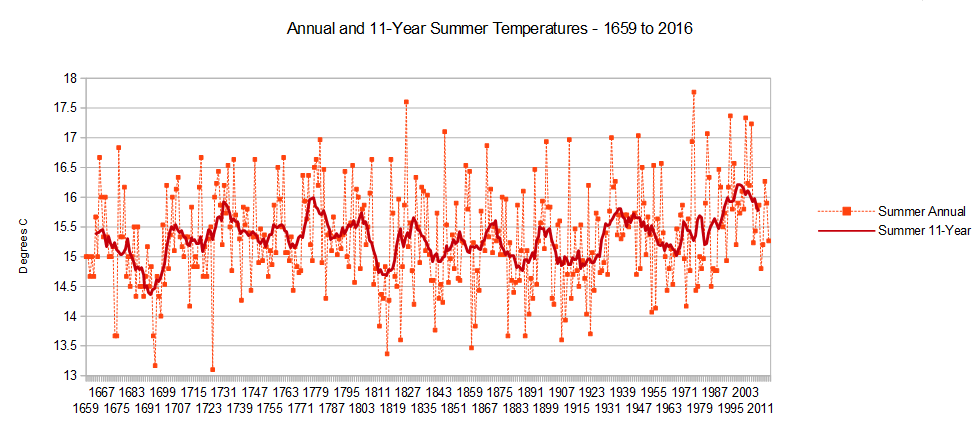
|
|
|
|
Post by missouriboy on Dec 2, 2016 21:31:40 GMT
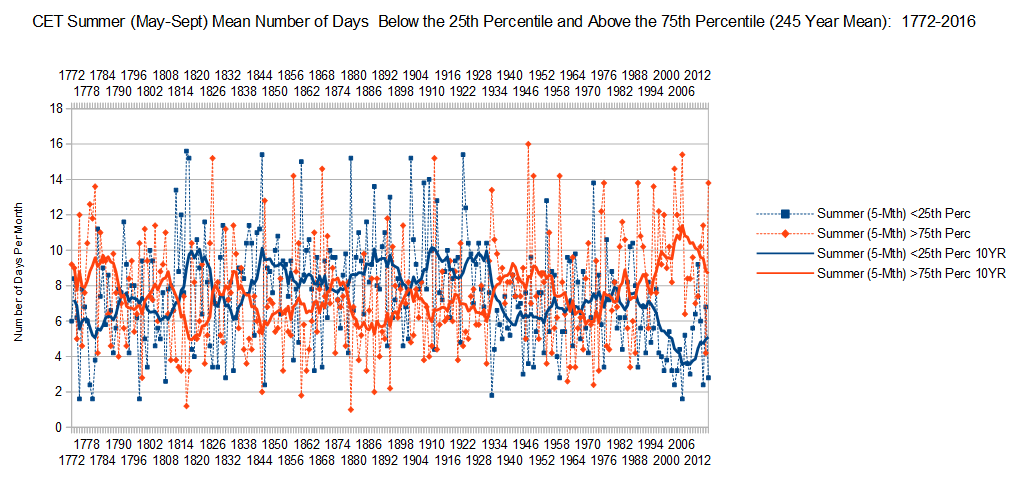
When I first started to travel regularly to London on business, it was always overcast and raining and foggy. I thought it amusing that the weather forecasts were for bright or dull referring to the thickness of the ever-present cloud cover rather than for cloudy or sunny. I always took a raincoat and a fold-up umbrella with me. When I was asked to play golf I'd politely refuse since the locals would play in the ever-present rain even if it was quite heavy and it wasn't fun for me. I noticed the lousy weather particularly in the summer because I would be leaving beautiful weather in the states. I can remember leaving London after days of fog and rain and when the plane would break above the clouds into the sunshine, the people on the plane would all notice. There was a plus side to the London weather since when my wife would bring up the idea of accompanying me on a London trip, I'd remind her of the lousy weather. She can do a lot of damage shopping at Harrods with a high limit on her credit card. Then, it seemed like the weather in London changed and there were many sunny days and I almost never needed an umbrella or raincoat and I quit taking them with me. I realize this is very anecdotal and the data might not support my observations and might just be attributable to luck. Missouriboy, your graph makes me wonder if there has been a change. If the plateau was approximately 30 years in length with a correlation to global temperatures, I'd be motivated to investigate in detail myself. Here is your 30-year plateau duwayne (actually a peak). Note the large increase in the mean number of summer days above the 75th percentile (mean daily temp. 1772-2016 Base) in the summer CET record starting in the late 1980s. Note the coincident decline (collapse) in the mean number of CET summer days below the 25th percentile. Less cold less clouds?
|
|
|
|
Post by acidohm on Nov 25, 2017 19:01:24 GMT
When I first started to travel regularly to London on business, it was always overcast and raining and foggy. I thought it amusing that the weather forecasts were for bright or dull referring to the thickness of the ever-present cloud cover rather than for cloudy or sunny. I always took a raincoat and a fold-up umbrella with me. When I was asked to play golf I'd politely refuse since the locals would play in the ever-present rain even if it was quite heavy and it wasn't fun for me. I noticed the lousy weather particularly in the summer because I would be leaving beautiful weather in the states. I can remember leaving London after days of fog and rain and when the plane would break above the clouds into the sunshine, the people on the plane would all notice. There was a plus side to the London weather since when my wife would bring up the idea of accompanying me on a London trip, I'd remind her of the lousy weather. She can do a lot of damage shopping at Harrods with a high limit on her credit card. Then, it seemed like the weather in London changed and there were many sunny days and I almost never needed an umbrella or raincoat and I quit taking them with me. I realize this is very anecdotal and the data might not support my observations and might just be attributable to luck. Missouriboy, your graph makes me wonder if there has been a change. If the plateau was approximately 30 years in length with a correlation to global temperatures, I'd be motivated to investigate in detail myself. Here is your 30-year plateau duwayne (actually a peak). Note the large increase in the mean number of summer days above the 75th percentile (mean daily temp. 1772-2016 Base) in the summer CET record starting in the late 1980s. Note the coincident decline (collapse) in the mean number of CET summer days below the 25th percentile. Less cold less clouds?

I'm just re-looking at all this analysis again MOboy...i was so busy last year at this time I came home ate and slept, wake work repeat 😝 Was looking for a home for this www.metoffice.gov.uk/hadobs/hadcet/ssn_HadCET_mean_sort.txtBut looking here I reckon you've already found it... Anyone else, Cet seasons ranked in order from 1650. There are some big suprised in there, mostly, look for recent years (hint....theyre rarely amongst the warmest.....) |
|
|
|
Post by acidohm on Nov 25, 2017 19:09:03 GMT
Found this on Wiki but not its complement for January ... nor anything showing change in this otherwise static picture. Oh what you could do with a digital, geographically referenced time series of daily and monthly pressure patterns at various levels of the atmosphere using the spatial analysis and display capabilities of a GIS. Get with it NOAA! Code: look at that 'spot' of descending air off the Northwest. What has that done since 2001? Adidohm: Is that semi-permanent Azores high weakening with more longitudinal flow? So many questions ... so little easily manipulable data. en.wikipedia.org/wiki/Hadley_cell#/media/File:Omega-500-july-era40-1979.png Vertical velocity at 500 hPa, July average in units of pascals per second. Ascent (negative values) is concentrated close to the solar equator; descent (positive values) is more diffuse. 500 hPa vertical velocity (Pa/S) in July from ERA-40 reanalysis, 1979-2001 average. Negative (blue) values represent rising air; positive (red) values indicate sinking air. This map is an excellent illustration of the Hadley cell. By [[en:User:William M In answer to your question, all I know is high pressure Azores to Iberia kept the developing meridional set-up from pulling the north/downward limb over uk, instead it fell over Lithuania, Romania and down to Saudi at times! This year it backed off, ridged up to greenland and the cold backdoor is open. Well below average here now ❄❄ |
|
|
|
Post by nautonnier on Nov 25, 2017 21:32:18 GMT
Found this on Wiki but not its complement for January ... nor anything showing change in this otherwise static picture. Oh what you could do with a digital, geographically referenced time series of daily and monthly pressure patterns at various levels of the atmosphere using the spatial analysis and display capabilities of a GIS. Get with it NOAA! Code: look at that 'spot' of descending air off the Northwest. What has that done since 2001? Adidohm: Is that semi-permanent Azores high weakening with more longitudinal flow? So many questions ... so little easily manipulable data. en.wikipedia.org/wiki/Hadley_cell#/media/File:Omega-500-july-era40-1979.png Vertical velocity at 500 hPa, July average in units of pascals per second. Ascent (negative values) is concentrated close to the solar equator; descent (positive values) is more diffuse. 500 hPa vertical velocity (Pa/S) in July from ERA-40 reanalysis, 1979-2001 average. Negative (blue) values represent rising air; positive (red) values indicate sinking air. This map is an excellent illustration of the Hadley cell. By [[en:User:William M In answer to your question, all I know is high pressure Azores to Iberia kept the developing meridional set-up from pulling the north/downward limb over uk, instead it fell over Lithuania, Romania and down to Saudi at times! This year it backed off, ridged up to greenland and the cold backdoor is open. Well below average here now ❄❄ Interesting that the map shows the orographic uplift from the Andes and the Himalayas as well as the ITCZ convection into the Hadley cells. |
|
|
|
Post by acidohm on Jul 2, 2019 8:06:46 GMT
|
|
|
|
Post by missouriboy on Jul 21, 2019 21:07:48 GMT
Following up on Acid's post ... it continues to a record. People should continually force the AGW crowd to address this ... How can CO2 accomplish this? Specific mechanics. To paraphrase General NBF, "Hit em on the eend" and "keep up a skeer". Press em till they drop in convulsions. twitter.com/mikarantane Mika Rantanen Retweeted Simon Cardy @weather_king Jul 14 More Today is the 80th consecutive day the NAO phase has been negative - which is a record based on data since 1900 (credit: @worldclimatesvc) 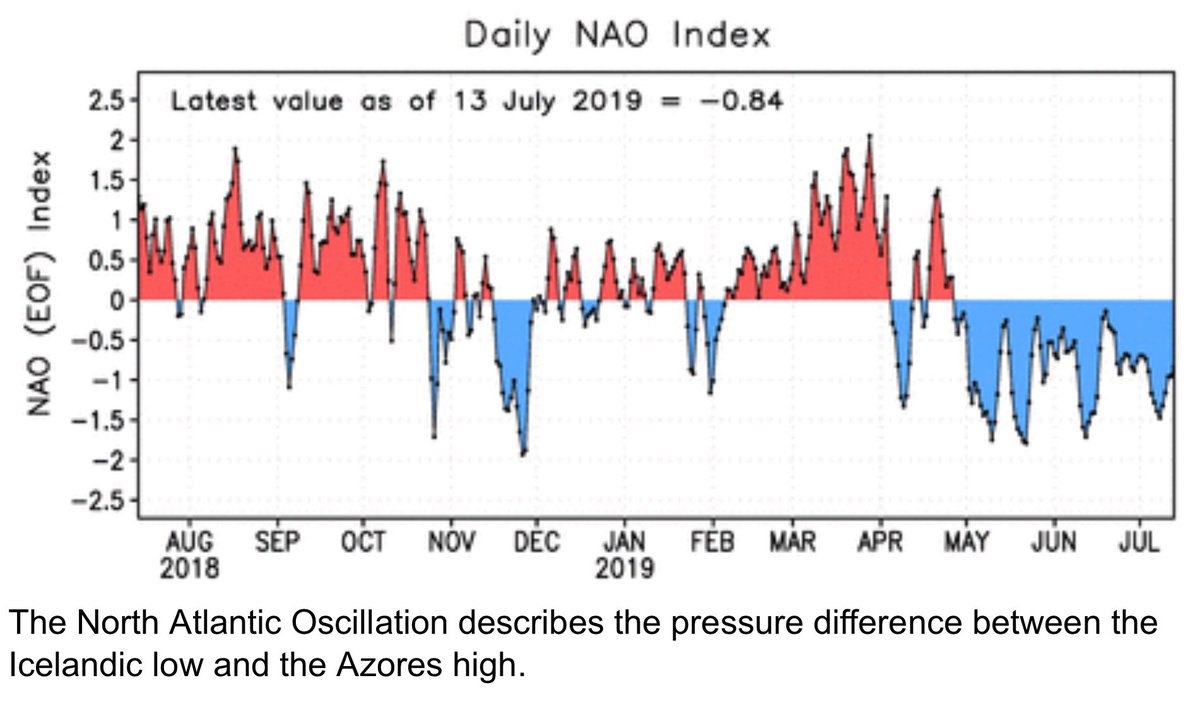 |
|
|
|
Post by Ratty on Jul 22, 2019 0:09:46 GMT
So, what does the record long negative NAO mean? Is there a consequence?
|
|
|
|
Post by missouriboy on Jul 22, 2019 3:48:23 GMT
So, what does the record long negative NAO mean? Is there a consequence? More Vikings in Miami.  |
|
|
|
Post by missouriboy on Jul 22, 2019 4:08:11 GMT
OR ... I found these. www.weatherworksinc.com/nao-definitionA lot of times meteorologists throw around fancy words and phrases that may not necessarily be common knowledge. One of them sometimes heard in the Northeast during winter is the NAO. NAO stands for the North Atlantic Oscillation and is a fluctuation in pressures between the central Atlantic Ocean and Greenland. But what does this have to do with our weather? After all, this stuff is happening so far away, why bother talking about it? As it turns out the NAO has major effects on our weather. Imagine a freeway that has no traffic. It’s pretty easy to zip from location A to B. This is basically a case of positive NAO in the atmosphere. Lower than normal pressures over Greenland land and higher than normal pressures over the Atlantic keep the east-west flow moving at a quick pace. Like cars on our freeway, storms move quickly west to east with minimal effects on our weather.
Now imagine a situation where along that same freeway the road is closed and traffic needs to be diverted elsewhere. This represents a negative NAO. Simply put the negative NAO creates an “atmospheric road block.” The westerly winds weaken, resulting in limited upper air flow over the entire North Atlantic extending all the way to the US East Coast. Storms are guided by the upper air wind pattern so when the upper air flow is weakened, the motion of the storms are slowed as well. Now the storms need to be rerouted around the block to get to where they want to go. If you were driving in your car and saw the road was closed up ahead, you would have to take a detour. This is what the storm essentially does. Often, the storms turn more southerly in the process, picking up abundant moisture right out of the Gulf of Mexico, before turning back north up the eastern seaboard. The reduced flow also keeps cold air locked into the eastern US. What happens when you combine rich Gulf of Mexico moisture with cold air? If you guessed big time snow, then you are most definitely right. In fact some of our biggest snow storms have occurred amidst a negative NAO. So next time you hear your local meteorologist say the NAO is going to become negative, watch out, because more often than not cold, snowy weather is on the way.BUT we are used to hearing about negative NAO in winter. What about summer? Which is what we're seeing now. Record cold one week, record warmth the next in parts of Europe. AND these pressure gradients appear to be not just confined to N America and W Europe. If I were a pessimist I'd say perhaps that George was right. "Pack your shit folks. We're going away."  But since I'm not, I'm going to have another coffee ... and buy a little more food and ammo. |
|