North Atlantic Pressure Patterns, the NAO and the CET Record
Nov 16, 2016 16:33:43 GMT
acidohm likes this
Post by missouriboy on Nov 16, 2016 16:33:43 GMT
North Atlantic atmospheric pressure patterns are often cited as important parameters affecting climates surrounding 'the Pond'. Their location, strength and changes direct atmospheric circulation. They are not themselves causes (as Astro might say) but owe their character to other forces that are postulated but poorly understood. Geographers are fascinated with spatial patterns. This is my attempt at self-education through an examination of the data. Here we are fortunate in the sense that primary sea surface pressure data have been collected at Gibraltar (36 N Lat.) and Reykjavik (64 N Lat.) since at least 1821. Central England temperature data have been collected since at least 1659. With these and other indices, it is my goal to see if I can slice, dice and mangle a semblance of understanding on climate patterns that have been observed around the N Atlantic over the centuries. Some of us have been rightly accused of blatant wiggle watching. I am interested in longer term wiggles that may be traced to larger forces ... and I might note that ... when wiggles accumulate literature, they are called cycles and get fancy 10-cent names attached to them. So, this adventure will advance (or regress) in fits and spurts as time allows.
Pressure Patterns in the N Atlantic since 1821 - Chart 1
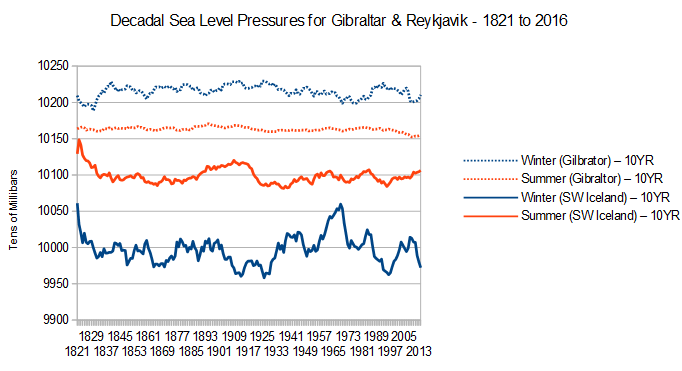
This is probably old news to most of you, but is inserted here as background. Chart 1 below shows sea level pressures (in tens of millibars) recorded at Gibraltar and Reykjavik for winter and summer months from 1821 to 2016. Source: www.esrl.noaa.gov/psd/gcos_wgsp/Timeseries/NAO/ and crudata.uea.ac.uk/cru/data/nao/. Pressure is almost always greater at Gibraltar than at Reykjavik reflecting the high pressure zone north of the equator associated with the descending limb of the the tropical Hadley cell. Pressure differences between the stations are least in summer as the tropical zone shifts northward, and greatest in winter as the opposite occurs. Pressure is highest in winter at Gibraltar and in summer at Reykjavik. Note: Monthly pressure data on these sites only cover the period 1821 to 2002. I collected the remainder of the time series from Weather Underground.
www.wunderground.com/history/

Pressure Patterns in Relation to Solar Cycles and the AMO (40-65N) - Charts 2 & 3
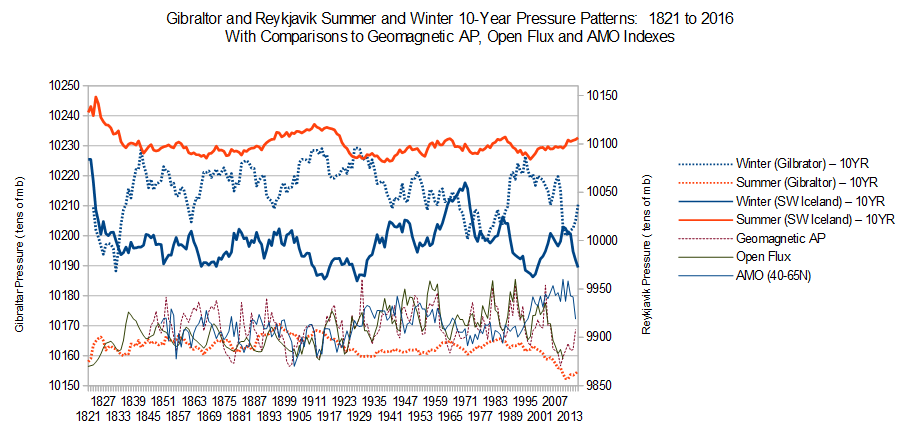
At Gibraltar, summer pressure values show minimums at each end of the time series, which coincide with the end of the extended Dalton Minimum period and the current solar downturn, although actual pressure declines began at the end of SC22. Pressure peaks occur in the 1890-1920 and 1960-2000 periods, both of which span the minor solar activity declines centered on 1900 and 1970. Winter Gibraltar pressure patterns broadly mirror the summer series with more variance ... deep lows at either end with highs in the 1900-1930 and 1980-2000 periods. There is also a deep low focused on the solar low of the 1960s and 1970s. Nautonnier (in an Arctic Ice post) observed that greater equatorward penetration of northern lows associated with longitudinal flow could account for these observations. Less obvious are mechanisms accounting for pressure increases spanning minor periods of lowered solar activity, although the actual peak pressures in the first period precede the low solar cycle and in the second period largely occur after it.
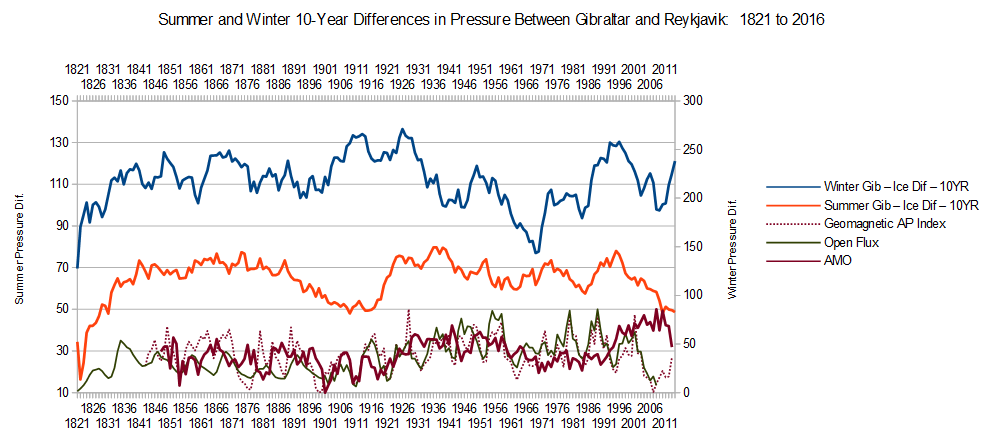
At Reykjavik, summer and winter pressures are dramatically higher in the early 1820s coming out of the Dalton Minimum. These, in combination with lower Gibraltar pressures, result in an extremely low inter-station pressure gradient in both summer and winter (Chart 3). Moderate pressure increases at Reykjavik in summer since about 1996, coupled with a historically large decline at Gibraltar have produced the lowest inter-station pressure gradient since the 1820s. Winter pressures had also been rising since about 1996, but have had a 3-year hiatus since 2013. Even so, the pressure gradient is lower than it was in 1996 (Chart 3). Notice the 'mirroring' (reverse direction) trends in winter pressure patterns between the two stations and the associated gradients in Chart 3. While the 1820s and the 2000s show lowered gradients in both seasons, the minor solar low periods of 1890-1920 and 1960-1975 show lowered pressure gradients in one season only ... summer in the former and winter in the later.


A Comparison of Decadal Winter and Summer NAO Indexes to Solar Indexes
The NAO index is a normalized deviation index constructed from pressure differences between Gibraltar and Reykjavik. More recent values use the Azores, but Gibraltar-Reykjavik values are available back to 1821, so I'm using them. The procedure is to select a baseline time period (1864-1983 has been standard), calculate a monthly deviation by subtracting the monthly mean baseline value from the recorded monthly pressure average for each station, and divide the deviation by the station-specific monthly standard deviation for the base period. This brings the station with greater variance (Reykjavik) into line with the station with less variance (Gibraltar). The NAO statistic is then calculated by subtracting Reykjavik from Gibraltar. Positive values represent a large (high) pressure gradient between the two stations. Negative values represent a small (low) pressure gradient. The literature states that the former are associated with a strong polar vortex and zonal westerly flow while the later is associated with a weak vortex and longitudinal flow patterns.
For visual comparison, I created normalized deviation indexes for the Solar Open Flux time series and the Geomagnetic AP index. I over-plotted these with decadal running averages of the NAO. While this may be a visual exaggeration (or not), the picture that emerges is troubling? The NAO emerges as a plateau from about 1840 to 2000 with its ends dropping down steep solar gradients. There may be other interpretations. There is an interesting winter, strong pressure gradient 'bump' that occurs right in the middle of this plateau that is also recognizable in the CET temperature record. But more on that in the next section.
So ... is this plateau real ... or a figment? Is the current 15-year 'plunge' a precursor to what Astro has forecast? Or is this one of them 'statistical mirages'?

Pressure Patterns in the N Atlantic since 1821 - Chart 1
This is probably old news to most of you, but is inserted here as background. Chart 1 below shows sea level pressures (in tens of millibars) recorded at Gibraltar and Reykjavik for winter and summer months from 1821 to 2016. Source: www.esrl.noaa.gov/psd/gcos_wgsp/Timeseries/NAO/ and crudata.uea.ac.uk/cru/data/nao/. Pressure is almost always greater at Gibraltar than at Reykjavik reflecting the high pressure zone north of the equator associated with the descending limb of the the tropical Hadley cell. Pressure differences between the stations are least in summer as the tropical zone shifts northward, and greatest in winter as the opposite occurs. Pressure is highest in winter at Gibraltar and in summer at Reykjavik. Note: Monthly pressure data on these sites only cover the period 1821 to 2002. I collected the remainder of the time series from Weather Underground.
www.wunderground.com/history/

Pressure Patterns in Relation to Solar Cycles and the AMO (40-65N) - Charts 2 & 3
At Gibraltar, summer pressure values show minimums at each end of the time series, which coincide with the end of the extended Dalton Minimum period and the current solar downturn, although actual pressure declines began at the end of SC22. Pressure peaks occur in the 1890-1920 and 1960-2000 periods, both of which span the minor solar activity declines centered on 1900 and 1970. Winter Gibraltar pressure patterns broadly mirror the summer series with more variance ... deep lows at either end with highs in the 1900-1930 and 1980-2000 periods. There is also a deep low focused on the solar low of the 1960s and 1970s. Nautonnier (in an Arctic Ice post) observed that greater equatorward penetration of northern lows associated with longitudinal flow could account for these observations. Less obvious are mechanisms accounting for pressure increases spanning minor periods of lowered solar activity, although the actual peak pressures in the first period precede the low solar cycle and in the second period largely occur after it.
At Reykjavik, summer and winter pressures are dramatically higher in the early 1820s coming out of the Dalton Minimum. These, in combination with lower Gibraltar pressures, result in an extremely low inter-station pressure gradient in both summer and winter (Chart 3). Moderate pressure increases at Reykjavik in summer since about 1996, coupled with a historically large decline at Gibraltar have produced the lowest inter-station pressure gradient since the 1820s. Winter pressures had also been rising since about 1996, but have had a 3-year hiatus since 2013. Even so, the pressure gradient is lower than it was in 1996 (Chart 3). Notice the 'mirroring' (reverse direction) trends in winter pressure patterns between the two stations and the associated gradients in Chart 3. While the 1820s and the 2000s show lowered gradients in both seasons, the minor solar low periods of 1890-1920 and 1960-1975 show lowered pressure gradients in one season only ... summer in the former and winter in the later.


A Comparison of Decadal Winter and Summer NAO Indexes to Solar Indexes
The NAO index is a normalized deviation index constructed from pressure differences between Gibraltar and Reykjavik. More recent values use the Azores, but Gibraltar-Reykjavik values are available back to 1821, so I'm using them. The procedure is to select a baseline time period (1864-1983 has been standard), calculate a monthly deviation by subtracting the monthly mean baseline value from the recorded monthly pressure average for each station, and divide the deviation by the station-specific monthly standard deviation for the base period. This brings the station with greater variance (Reykjavik) into line with the station with less variance (Gibraltar). The NAO statistic is then calculated by subtracting Reykjavik from Gibraltar. Positive values represent a large (high) pressure gradient between the two stations. Negative values represent a small (low) pressure gradient. The literature states that the former are associated with a strong polar vortex and zonal westerly flow while the later is associated with a weak vortex and longitudinal flow patterns.
For visual comparison, I created normalized deviation indexes for the Solar Open Flux time series and the Geomagnetic AP index. I over-plotted these with decadal running averages of the NAO. While this may be a visual exaggeration (or not), the picture that emerges is troubling? The NAO emerges as a plateau from about 1840 to 2000 with its ends dropping down steep solar gradients. There may be other interpretations. There is an interesting winter, strong pressure gradient 'bump' that occurs right in the middle of this plateau that is also recognizable in the CET temperature record. But more on that in the next section.
So ... is this plateau real ... or a figment? Is the current 15-year 'plunge' a precursor to what Astro has forecast? Or is this one of them 'statistical mirages'?


 Data from 1996 seem to be visually available from weather underground on their website. I used this to fill in the monthly gaps since 2002, which is when the available crudata ended. So ... you know the data are there ... if you know anyone that holds the key to the treasure.