|
|
Post by duwayne on Jun 8, 2020 17:25:02 GMT
DuWayne's graph gave me an idea. After noticing that Every (All 6) Pre-cycle La Nina since 1950 begins its plunge from Nino territory in early summer (usually June) of the year in which the new solar cycle kicks off, I took my monthly ENSO-ONI index for the NINO 3.4 area and charted it starting in January of that year for 50 months. You will note the sets of progressively positive synchronous waves moving toward solar maximum. Every cycle shows the peaks and troughs ... generally 12 months apart. Usually the first wave is deepest ... but sometimes the second is. If this is the year, our drop should happen very soon. The legend box year is the graph start year for that cycle. The Nino Mid-Pacific Heartbeat. The first 36 months of each temporal transect are highlighted in yellow on Chart 2. 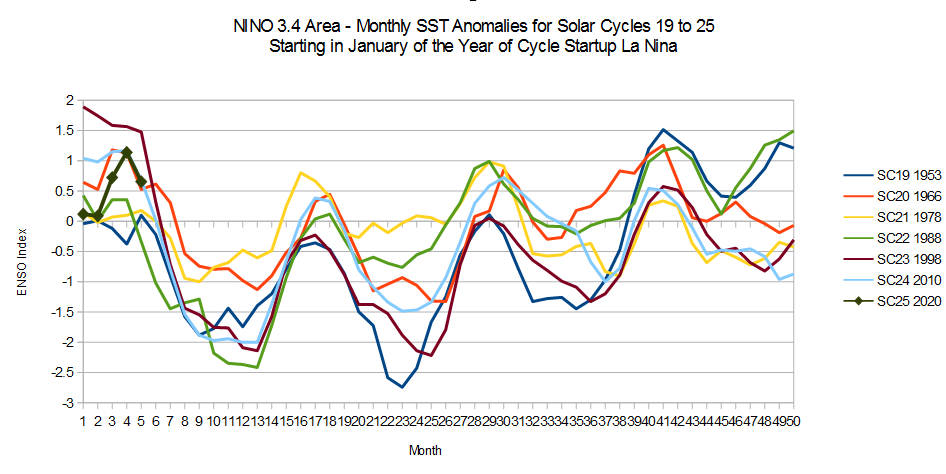 Missouri, that's a great chart. Since the ONI didn't start out high this year, I was hesitant about predicting the big drop but I noted that it was a real possibility. The weekly ONI's have dropped considerably in the last 2 weeks, so the likelihood of a super La Nina actually is now quite high. As you know the beauty of this chart is that it allows you to predict future global temperature changes with more accuracy than the governmental agencies. |
|
|
|
Post by missouriboy on Jun 8, 2020 20:42:20 GMT
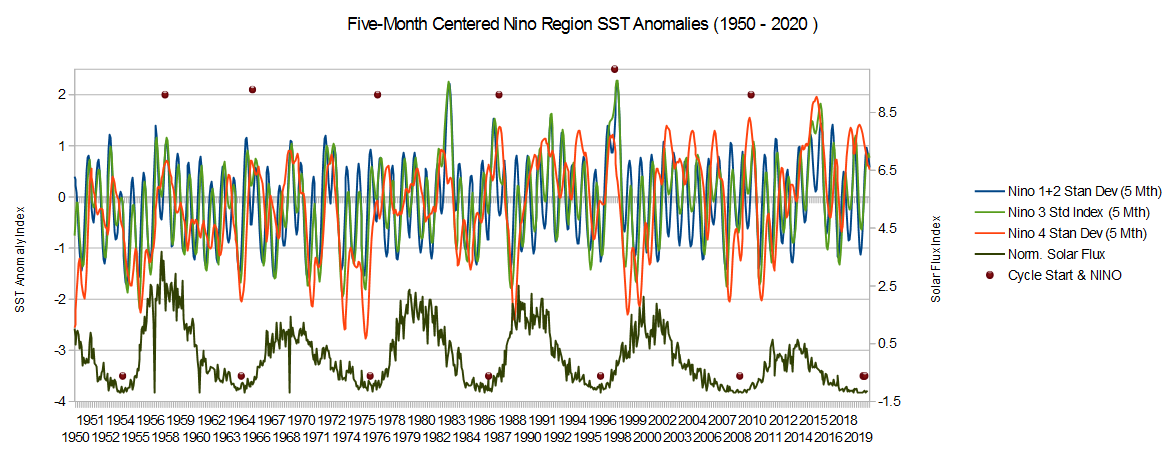
DuWayne's graph gave me an idea. After noticing that Every (All 6) Pre-cycle La Nina since 1950 begins its plunge from Nino territory in early summer (usually June) of the year in which the new solar cycle kicks off, I took my monthly ENSO-ONI index for the NINO 3.4 area and charted it starting in January of that year for 50 months. You will note the sets of progressively positive synchronous waves moving toward solar maximum. Every cycle shows the peaks and troughs ... generally 12 months apart. Usually the first wave is deepest ... but sometimes the second is. If this is the year, our drop should happen very soon. The legend box year is the graph start year for that cycle. The Nino Mid-Pacific Heartbeat. The first 36 months of each temporal transect are highlighted in yellow on Chart 2. Missouri, that's a great chart. Since the ONI didn't start out high this year, I was hesitant about predicting the big drop but I noted that it was a real possibility. The weekly ONI's have dropped considerably in the last 2 weeks, so the likelihood of a super La Nina actually is now quite high. As you know the beauty of this chart is that it allows you to predict future global temperature changes with more accuracy than the governmental agencies. Perhaps they will send me a check.  Having previously shown that UAH Lower Troposphere temperature anomalies for the Tropical Oceans and Globe track ENSO SST anomalies with a slight lag (Graph 1 below), I expected that UAH Lower Troposphere temperature anomalies might track the stacked 50-Month SST anomaly trends for solar cycles 22, 23 and 24. And so they do. Chart 2 below shows that UAH tropical ocean temperatures during SC's 22, 23 and 24 decline by between 1.2 to 1.4 C over a 6-8 month period into the first of the three ENSO pulses. Only SC24 actually rises and sinks into the second pulse. Chart 3 shows that global and tropical ocean UAH temperature anomalies trend together. 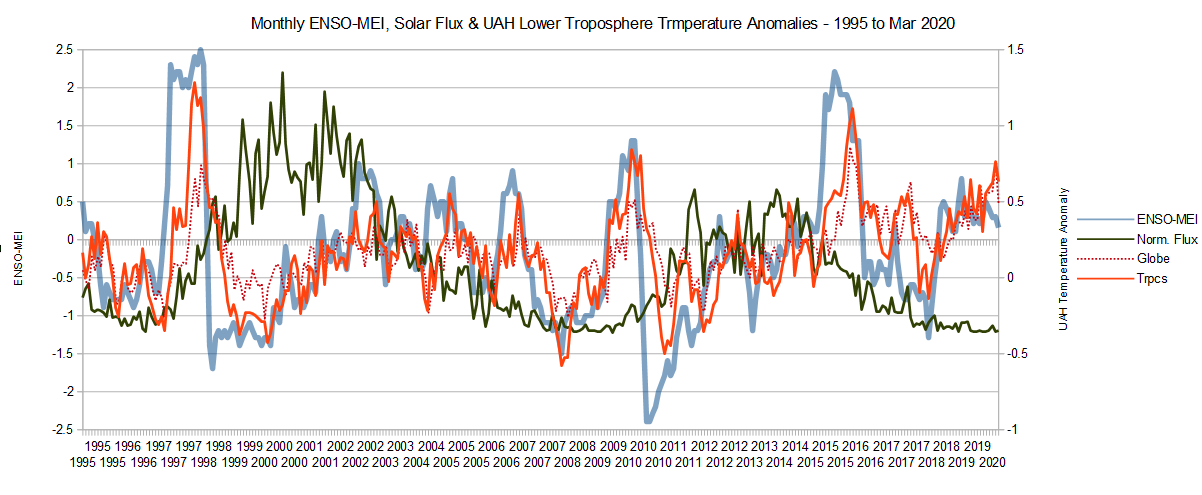 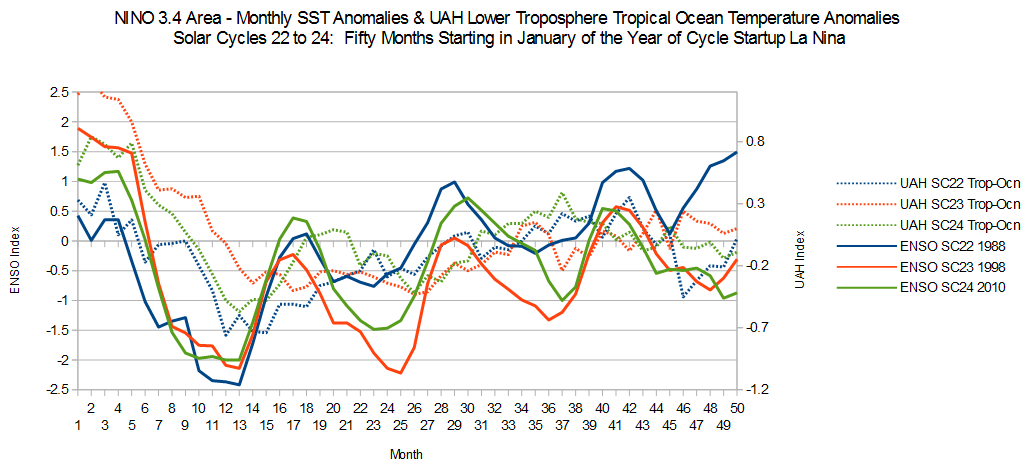 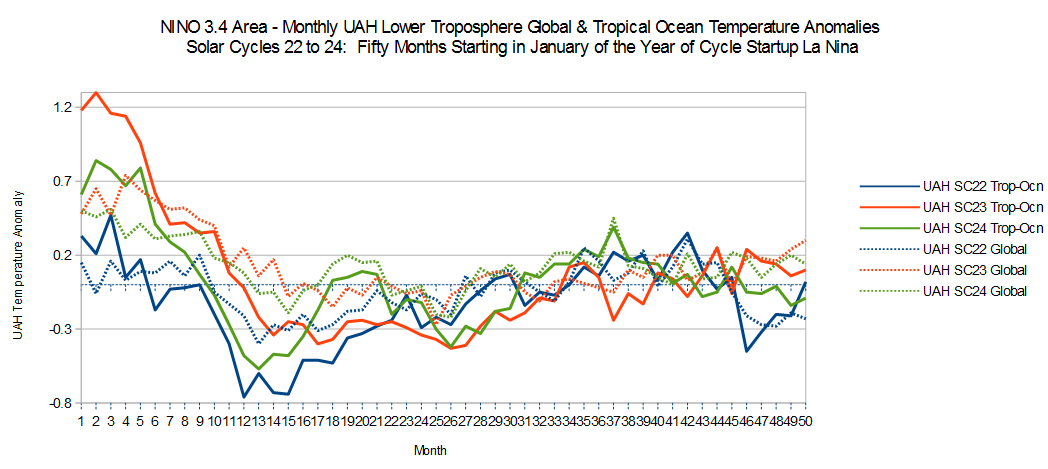 |
|
|
|
Post by Ratty on Jun 9, 2020 12:19:29 GMT
|
|
|
|
Post by missouriboy on Jun 9, 2020 19:35:40 GMT
If this is to be pre-cycle La Nina year, SOI should "blast off" in June or July (August latest in series). If not, then the long-standing rule is broken, or SC24 is going to be long. I'm assuming there is a reason that the pre-cycle Nino-Nina combo begins at the very start of every cycle so far. As we wait to see what happens over the summer, I put together this chart showing SOI, ENSO-ONI & NINO 3.4 together with Solar Flux and Geomagnetic AP for five solar cycles (SC20-SC24). Lot of data here. Singleton low cycle 20 was the second longest cycle in the series (slightly shorter than SC23) and was followed by a larger cycle (SC21) that began the second half of the modern maximum. The SC20-SC21 progression was strange, as the pre-cycle Nino-Nina combo was very small for SC21. But the longest, deepest Nina period in the whole, nearly 60-year record occurred in the long tail of SC20. 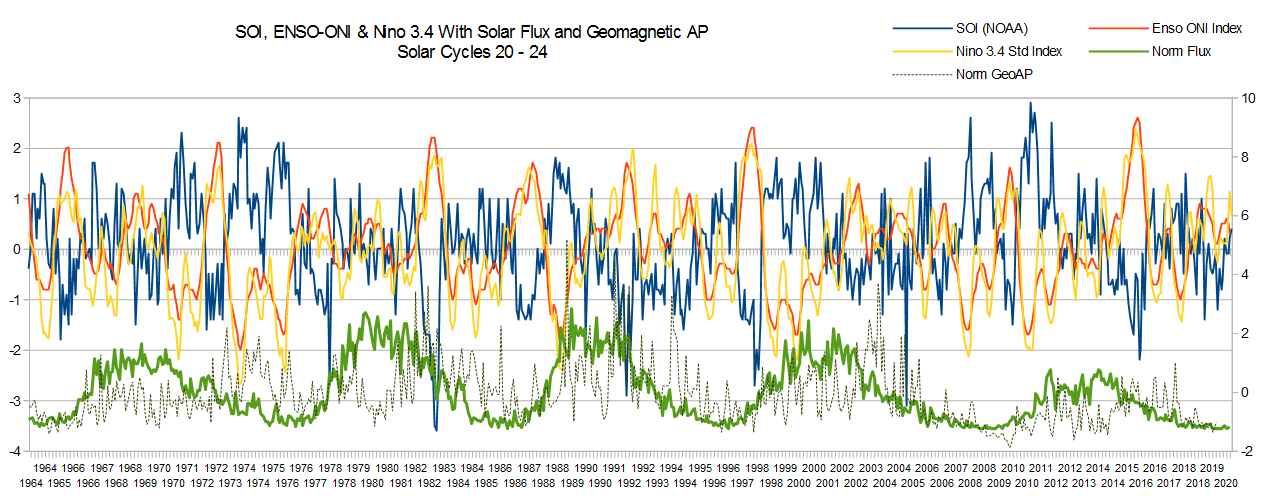 |
|
|
|
Post by duwayne on Jun 10, 2020 15:49:31 GMT
If this is to be pre-cycle La Nina year, SOI should "blast off" in June or July (August latest in series). If not, then the long-standing rule is broken, or SC24 is going to be long. I'm assuming there is a reason that the pre-cycle Nino-Nina combo begins at the very start of every cycle so far. As we wait to see what happens over the summer, I put together this chart showing SOI, ENSO-ONI & NINO 3.4 together with Solar Flux and Geomagnetic AP for five solar cycles (SC20-SC24). Lot of data here. Singleton low cycle 20 was the second longest cycle in the series (slightly shorter than SC23) and was followed by a larger cycle (SC21) that began the second half of the modern maximum. The SC20-SC21 progression was strange, as the pre-cycle Nino-Nina combo was very small for SC21. But the longest, deepest Nina period in the whole, nearly 60-year record occurred in the long tail of SC20. Missouri, have you tried an inverse SOI on the chart? |
|
|
|
Post by missouriboy on Jun 10, 2020 18:53:06 GMT
If this is to be pre-cycle La Nina year, SOI should "blast off" in June or July (August latest in series). If not, then the long-standing rule is broken, or SC24 is going to be long. I'm assuming there is a reason that the pre-cycle Nino-Nina combo begins at the very start of every cycle so far. As we wait to see what happens over the summer, I put together this chart showing SOI, ENSO-ONI & NINO 3.4 together with Solar Flux and Geomagnetic AP for five solar cycles (SC20-SC24). Lot of data here. Singleton low cycle 20 was the second longest cycle in the series (slightly shorter than SC23) and was followed by a larger cycle (SC21) that began the second half of the modern maximum. The SC20-SC21 progression was strange, as the pre-cycle Nino-Nina combo was very small for SC21. But the longest, deepest Nina period in the whole, nearly 60-year record occurred in the long tail of SC20. Missouri, have you tried an inverse SOI on the chart? Mostly they fit very well.  |
|
|
|
Post by missouriboy on Jun 15, 2020 13:02:47 GMT
Look what's expanding from the East in the Tropical Atlantic. Coincidence, right?  |
|
|
|
Post by glennkoks on Jun 15, 2020 23:29:47 GMT
Look what's expanding from the East in the Tropical Atlantic. Coincidence, right? Great question. I have often wondered where the cooling would start first when the Atlantic Multidecadal Oscillation flips from its current warm phase to a cooler one. Would it spread from the north south? Or counterintuitively from the south to the north? Or just kind of equally all over? Unfortunately satellite SST data does not go back that far so this will be a learning experience. I have always theorized that it would come from a slowing of the Gulf Stream and a gradual cooling effect. I think we will learn a lot when the AMO does flip. |
|
|
|
Post by glennkoks on Jun 16, 2020 14:35:58 GMT
It would be nice if we had an image like this from the mid 1970's to compare and contrast.
|
|
|
|
Post by missouriboy on Jun 16, 2020 19:59:48 GMT
|
|
|
|
Post by acidohm on Jun 17, 2020 7:49:44 GMT
There does appear to be a trend where the higher temps are maintained post maximum, the harder they fall....sometime after about now. |
|
|
|
Post by duwayne on Jun 17, 2020 17:23:45 GMT
There does appear to be a trend where the higher temps are maintained post maximum, the harder they fall....sometime after about now. Here's why that happens.
Normally the wind at the equator blows from the east to the west. This causes water to be pushed west and as a result the western ocean surface is higher than the east. As the water is pushed west it is replaced to some extent by cooler upwelling water in the east. As a result the eastern Pacific is normally cooler than the western pacific although this doesn't show if you are looking at anomalies which have the differnce subtracted out.
If the winds to the west increase significantly, the water stacks up more. If the winds return to normal, the warmed stacked water will slosh back to the east resulting in warmer surface temperatures in the east. The degree of warming is partly due to how much water was stacked.
The reverse of the above situation also happens.
This sloshing of water back and forth contributes to ENSO readings.
This year started without an abnormal water stacking in the east, therefore, I was skeptical about a super La Nina even though other signs were there. But a super La Nina can still occur as long as there are sufficiently strong east to west winds or strong east to west ocean currents resulting from other factors.
|
|
|
|
Post by missouriboy on Jun 19, 2020 16:23:56 GMT
I found an SST anomaly data set for the Western Pacific Warm Pool (at psl.noaa.gov/data/climateindices/list/) which completes the tropical Pacific west-to-east ENSO Regions. This data set was compiled from 1948 to 2008 for the Indo-Pacific Warm Pool (60E-170E). Data for 2008-2018 was filled in from ARGO SST data which I had previously compiled for areas from 120E to 160E. Overlay of 2004-2008 data shows that the temporal changes between the two sets were comparable, although the absolute values varied. Unfortunately, the actual SSTs used to compile the anomalies were not found. So I jury rigged a compromise, and that is presented below with the anomaly data for Nino Regions 4, 3 and 1+2. I have no methodology so I assume the series was compiled either from SST or SSTA imagery. You will note the rise over time, which may be overstated because of the difference in areas OR due to imperfections in my jury rigged methods. However, it has the expected properties ... it drops as the kelvin wave heads east and recovers thereafter. There is upwards of a 10C difference in SST from west to east across Nino regions. The Nino events on the backside of SC21 and the foreside of SC23 are huge (in terms of their effects on regions 3 and 1+2). They dwarf all others and seem symmetrically place bracketing the center cycles of the receding large cycle period. Between these events, Ninas are warmer than those before or after. The 2015 Nino does not compare for regions 3 and 1+2, but is larger in region 4. The next couple of years will show whether the upcoming Nina plumbs the depths of those that occurred post SC20 and SC23. To get a better picture of the mechanics and relationship of ENSO in and across regions, refer to chart 2. Without the clutter, it is apparent that Nina Region 1+2 shows large annual ranges, whose negative values are truncated in Nino years and whose positive values are suppressed in Nina years. In strong El Ninos, there are no negative values for one or two annual cycles. In 1998, the deviations exceeded 5 C in one of two annual cycles. Region 3 hit plus 3 C. In comparison, the 2015 El Nino was much weaker in the Eastern Pacific, and Region 4 slightly exceeded 1998. In terms of sequencing, Region 3 seems to be in sync with Region 1+2, while Region 4 appears to peak before and after the more easterly regions. 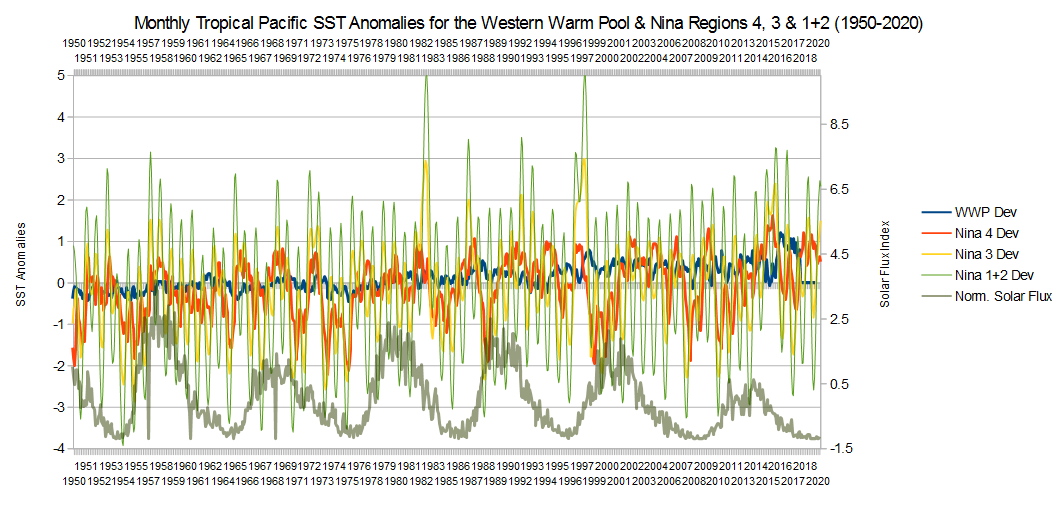 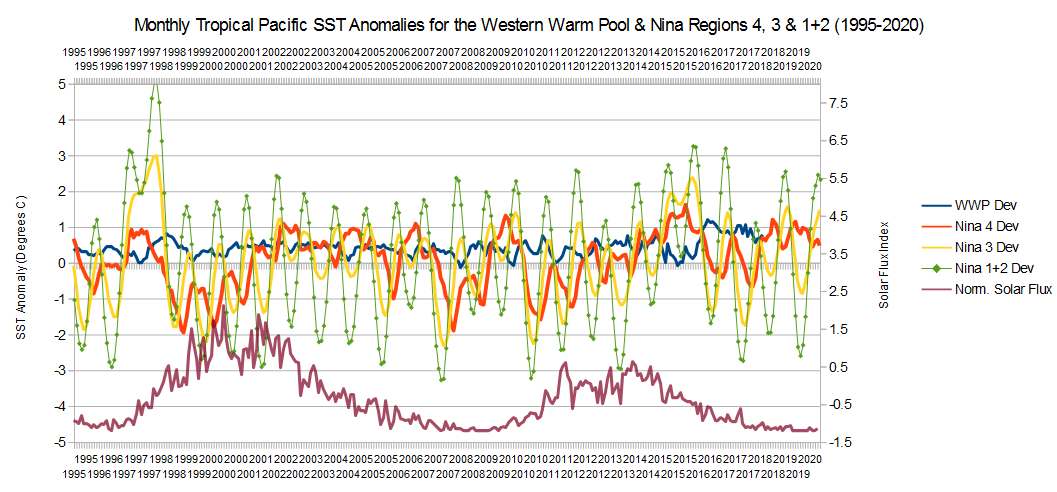 |
|
|
|
Post by nautonnier on Jun 21, 2020 18:59:08 GMT
Interesting sub-saharan cold plume, and another cold flow parallel to North Atlantic Drift(?)
|
|
|
|
Post by acidohm on Jun 21, 2020 22:55:05 GMT
Interesting sub-saharan cold plume, and another cold flow parallel to North Atlantic Drift(?) The potential fly in the ointment, IOD tracking +ve. Missouri, have we ever been privileged to see a graph comparing IOD to ENSO from you?? |
|


 Having previously shown that UAH Lower Troposphere temperature anomalies for the Tropical Oceans and Globe track ENSO SST anomalies with a slight lag (Graph 1 below), I expected that UAH Lower Troposphere temperature anomalies might track the stacked 50-Month SST anomaly trends for solar cycles 22, 23 and 24. And so they do. Chart 2 below shows that UAH tropical ocean temperatures during SC's 22, 23 and 24 decline by between 1.2 to 1.4 C over a 6-8 month period into the first of the three ENSO pulses. Only SC24 actually rises and sinks into the second pulse. Chart 3 shows that global and tropical ocean UAH temperature anomalies trend together.