|
|
Post by sigurdur on Sept 16, 2013 21:48:15 GMT
|
|
|
|
Post by sigurdur on Sept 16, 2013 22:12:17 GMT
Numno how come if skeptical science had data to 2009 as indicated in the sources for the graph did they only plot this graph to 2004? Oh thats right its skeptical science! Silly me! The SS paper on solar is not an accurate paper. But then, that shouldn't surprise us at all. |
|
|
|
Post by nautonnier on Sept 16, 2013 23:28:09 GMT
Meanwhile we are at Solar max as you can tell:  If this is the maximum what is the minimum going to be like? |
|
|
|
Post by cuttydyer on Sept 17, 2013 7:09:56 GMT
I'm for some reason quite unable to see anything on UK weather mentioned in your science links? I'm confused, are you still studying the UK weather, or is it "anything goes" now? You seem to be all over the place, yet nowhere N°1, the paper relates to the top down solar modulation of climate (cli-mate - weather conditions prevailing in an area in general or over a long period) in Europe; the last time I checked, the UK was still part of Europe. Are you experiencing one of your "strong feeling"(s) that climate does not relate to weather or the UK is no longer part of Europe? |
|
|
|
Post by cuttydyer on Sept 17, 2013 7:28:05 GMT
N°1, your SS graph relates only to TSI. The paper below (published 2005 in the journal of the Italian Astronomical Society) looks at the correlation between temperature and solar geomagnetic activity.  Paper link: sait.oat.ts.astro.it/MmSAI/76/PDF/969.pdf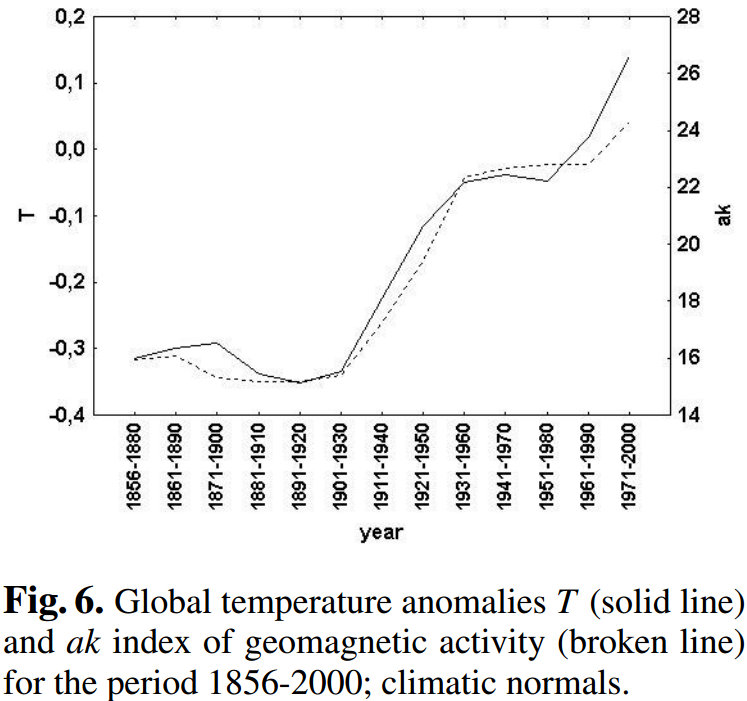 The paper finds that solar geomagnetic activity was highly correlated to global temperature changes over the period from 1856-2000. The authors "show that the index commonly used for quantifying long-term changes in solar activity, the sunspot number, accounts for only one part of solar activity and using this index leads to the underestimation of the role of solar activity in the global warming in the recent decades. A more suitable index is the geomagnetic activity which re?ects all solar activity, and it is highly correlated to global temperature variations in the whole period for which we have data." |
|
|
|
Post by numerouno on Sept 17, 2013 13:33:26 GMT
Ok then, here's the data on the aa index and the global surface temp. There is no statistical correlation. In fact the Fourier analysis finds that any cycles there might be, are of a totally different length, and of course phase.  article.sapub.org/pdf/10.5923.j.ajee.20120204.02.pdf article.sapub.org/pdf/10.5923.j.ajee.20120204.02.pdf |
|
|
|
Post by cuttydyer on Sept 17, 2013 14:02:30 GMT
Ok then, here's the data on the aa index and the global surface temp. There is no statistical correlation. In fact the Fourier analysis finds that any cycles there might be, are of a totally different length, and of course phase. N°1, good to see you posting links to papers that support a solar influence on the Earth's climate.  As you can see, your paper supports what I said about the shoddy Skeptical Science graph - "The geomagnetics aa are more effective on global surface temperature than solar activity". Your paper is based on the aa index, where as the one I posted above is Ap. Current real-time predictions use the Ap index. Though the correlation between the two indices is at the 0.9 level, the aa and Ap index do not always agree. As for aa, your paper states - "The present changes in aa geomagnetics may reflect partially some future changes in the global surface temperatures." |
|
|
|
Post by dontgetoutmuch on Sept 17, 2013 14:05:39 GMT
Numerouno, Have you really been reduced to using SS propaganda to support your beliefs? The Skeptical Science Blog is a laughingstock!. That graph is a joke. No one, to the best of my knowledge, after looking at how small TSI changes are, as suggested that it could have an effect on temperature. The SS graph uses TSI and labels it "Solar Activity", but it has to "zoom" in the vertical axis to ridiculous levels to show any TSI variation at all. Do us all a favor, put some error bars on that graph, and take the data to 2012. Then perhaps even you can see how absolutely misleading the authors are trying to be... SS is attempting to demonstrate that lack of correlation between GISS's highly suspect temperature data and TSI's execptionally small changes of tenths of a watt/m2 over the course of a century prove something other than the folks a SS have reached Baghdad Bob levels of incompetence. Oh, and at least Bob was fun to watch. The SS guys are just pathetic. |
|
|
|
Post by numerouno on Sept 17, 2013 14:07:07 GMT
Cuttydyer, please feel free to find any correlations between the above aa and surface temp data. You can also publish, and be famous.
|
|
|
|
Post by numerouno on Sept 17, 2013 14:11:04 GMT
ridiculous levels to show any TSI variation at all. Do us all a favor, put some error bars on that graph, and take the data to 2012. Sorry, I can't and won't doctor other people's data. If you have a way to instate "error bars" into any data and extend them, then please do that, but strictly on your own. I can't personally help with the TSI variations being quite small. Some folks argue they have a huge influence all the same, but it does not seem to be the case. |
|
|
|
Post by dontgetoutmuch on Sept 17, 2013 14:16:12 GMT
ridiculous levels to show any TSI variation at all. Do us all a favor, put some error bars on that graph, and take the data to 2012. Sorry, I can't and won't doctor other people's data. If you have a way to instate "error bars" into any data and extend them, then please do that, but strictly on your own. I can't personally help with the TSI variations being quite small. Some folks argue they have a huge influence all the same, but it does not seem to be the case. Yet you are all to willing to pass on the doctored data from skeptical science. That graph is nothing but bunk, why would you post it? |
|
|
|
Post by dontgetoutmuch on Sept 17, 2013 14:33:08 GMT
ridiculous levels to show any TSI variation at all. Do us all a favor, put some error bars on that graph, and take the data to 2012. Sorry, I can't and won't doctor other people's data. If you have a way to instate "error bars" into any data and extend them, then please do that, but strictly on your own. I can't personally help with the TSI variations being quite small. Some folks argue they have a huge influence all the same, but it does not seem to be the case. Actually some folk argue that there must be a solar influence on temperature. The mechanism does not appear to be TSI. For SS to choose that metric, which clearly does not correlate, is deliberately misleading on the part of SS. To the best of my knowledge, No one has suggested that TSI is a mechanism. There has been only a single theory advanced at this stage that might support a mechanism. That mechanism is solar wind speed affecting cosmic ray strikes on the planet, which in turn affects cloud formation. To the best of my knowledge that theory has not been invalidated. |
|
|
|
Post by cuttydyer on Sept 17, 2013 14:39:15 GMT
Cuttydyer, please feel free to find any correlations between the above aa and surface temp data. You can also publish, and be famous. What's wrong with the ak index correlation? While we're on the subject N°1, have you seen this paper on the climatic influence of coronal holes:  Paper link: www.cfa.harvard.edu/~wsoon/Hiremath2012-d/Soonetal00NA.pdf"An unusual interdisciplinary study by astronomers and climatologists has found a striking correlation between holes in the outermost layer of the sun--or the corona--and the globally averaged temperature of the Earth, suggesting that the Earth's atmospheric temperature may be strongly linked to solar magnetism changes over months or years." At present, the Sun's surface is covered in rather a lot of coronal holes:  The coronal hole ringed in the above image could be mistaken for a graphical and gratuitous statement intended for the IPCC. |
|
|
|
Post by sigurdur on Sept 17, 2013 16:47:55 GMT
William posted numerous papers showing solar influence. That thread should have carried forward. On phone, but next time I am near puter I will look for it unless someone beats me to it.
|
|
|
|
Post by icefisher on Sept 17, 2013 18:03:36 GMT
Yep Numno is just putting up anything he can find that doesn't correlate. Perhaps if he can find a graph of the ak index that doesn't correlate then he could at least argue that the ak index might be subject to bias. Otherwise he could just post pictures of a bunch of bananas and claim that doesn't correlate. Please try really hard to stay on topic Numno! Here is an article that shows a different kind of correlation of the aa index to global temperatures. www-ssc.igpp.ucla.edu/personnel/russell/papers/731/731index.htmIt appears that when the amplitude of aa index is measured against the mean of the 22 year geomagnetic solar cycle and it is high there is cooling (1862 to 1908) or not so high flat temperatures (1949 to 1970) This is in time with the PDO index. Interesting stuff. Here is a diagram of this with the top tracing showing amplitude variations over blocks of time in the aa index. So it appears the correlation is in the aa index but Numno and SS or whereever he got his latest stuff from simply put the blinders on so they couldn't find the correlation.  It would be interesting to talk about the difference between the aa and ak indices. |
|