|
|
Post by sigurdur on Sept 17, 2013 18:35:37 GMT
As always. as shown by Dr. Svalgaard, TSI has been pretty flat. The other measurements show large variation and considerable correlation to surface temps
|
|
|
|
Post by numerouno on Sept 18, 2013 3:02:55 GMT
Yep Numno is just putting up anything he can find that doesn't correlate. Yes, like the graph of the data, and not some wacky derivations of it. If you think you can show there is any correlation between the aa and the global surface temp, you are welcome to. The Fourier analysis really tells all there is to tell. Different cycle lengths, and different trends.  source: article.sapub.org/pdf/10.5923.j.ajee.20120204.02.pdf |
|
|
|
Post by cuttydyer on Sept 18, 2013 7:09:25 GMT
Yep Numno is just putting up anything he can find that doesn't correlate. Yes, like the graph of the data, and not some wacky derivations of it. If you think you can show there is any correlation between the aa and the global surface temp, you are welcome to. N°1, will this do? Here's a paper divulging a statistically significant correlation between the aa index and annual global and hemispheric surface air temperature anomalies:  Paper link Paper linkAbstract Statistical analysis of the data series from 1856 to 2000 for the annual global and hemispheric surface air temperature anomalies is completed. Statistically significant correlations are found between global and hemispheric temperature anomalies and solar and geomagnetic indices. The temperature anomalies in the Northern and Southern hemispheres show similar statistical relations with the solar and geomagnetic indices. The cross-correlation analysis shows no statistically significant global temperature lag behind the sunspots as well as behind aa-indices. Decadal and long-term (low-frequency) components with various amplitudes are observed in the three spectra. The similarity of the Fourier spectra of the global surface temperature, sunspots and aa-indices suggests a possible significant correlation between the global temperature and the solar and geomagnetic activity.  Spectral densities of the global surface air temperature (top panel), sunspots (middle panel), and geomagnetic aa-indices (bottom panel).  |
|
|
|
Post by icefisher on Sept 18, 2013 7:38:03 GMT
Yep Numno is just putting up anything he can find that doesn't correlate. Yes, like the graph of the data, and not some wacky derivations of it. If you think you can show there is any correlation between the aa and the global surface temp, you are welcome to. The Fourier analysis really tells all there is to tell. Different cycle lengths, and different trends. source: article.sapub.org/pdf/10.5923.j.ajee.20120204.02.pdfWe know that anything that does not conform to your religious beliefs is automatically wacky by your definition. And anything that does not support another viewpoint is Godly! FYI, the aa index is not the only scientifically interesting index related to geomagnetism of the sun. I showed you already a correlation of periods or rising and falling temperatures related to the aa index. If you think its wacky you should make a case for that rather than standing there looking like an idiot waving his arms. solar influence on the climate is a given. Even the warmist community has finally adopted it. They do need an explanation for the LIA cooling and it appears some of that may be forthcoming in the latest IPCC draft where half the warming has been attributed to natural variation since 1951. Since the warming rate since then is about .12degC/decade, that puts natural variation at .06degC/decade. So as that natural variation changes direction you have explained the flat period in recent temperatures. Of course if Astromet proves correct they will be adjusting it again come the next report if there is another report. .6degC/century hardly seems compelling even if it triples over time. And as an outside observer with a lot of experience in people having to make adjustments to their favorite theory, there is well better than an even chance they have not yet allowed for all the uncertainty that they need allowances for. If they don't then there must have been one helluva lot of arm twisting going on behind the scenes. |
|
|
|
Post by numerouno on Sept 18, 2013 8:11:01 GMT
|
|
|
|
Post by numerouno on Sept 18, 2013 8:44:23 GMT
If you read the small print so to speak, the study says there is no correlation after the year 1930 -- something that even some casual eyeballing would show. The study in other words fails its stated results about 50% of the period if claims to have studied! |
|
|
|
Post by cuttydyer on Sept 18, 2013 9:19:10 GMT
If you read the small print so to speak, the study says there is no correlation after the year 1930 -- something that even some casual eyeballing would show. The study in other words fails its stated results about 50% of the period if claims to have studied! So N°1, you're quite comfortable with the correlation between: RSS MSU lower trop. global mean temp  and: CO2 ERSL mean  But, you're not comfortable with:  Can you provide an explanation? |
|
|
|
Post by numerouno on Sept 18, 2013 9:36:57 GMT
Cuttydyer, let's not change the subject, ok?
The studies show there is no link between any type of solar activity and the global surface temp.
Are you dealing with it?
|
|
|
|
Post by cuttydyer on Sept 18, 2013 9:44:25 GMT
Cuttydyer, let's not change the subject, ok? I thought we were discussing the correlation between solar activity and the Earth's climate? The studies show there is no link between any type of solar activity and the global surface temp. Aside from the studies you have chosen to ignore. With good humour & endless patience. Now, back to my question on correlation: So N°1, you're quite comfortable with the correlation between: RSS MSU lower trop. global mean temp and: CO2 ERSL mean But, you're not comfortable with: Can you provide an explanation? |
|
|
|
Post by numerouno on Sept 18, 2013 9:54:18 GMT
If you promise to for forever stop posting the same material repeatedly, as if we were children, I can consider providing an explanation.
|
|
|
|
Post by Andrew on Sept 18, 2013 10:00:12 GMT
Cuttydyer
Whats your point here?
There are no established statistically significant links to changing climate and solar activity.
We have no way of knowing if the maunder minimum was coincidence or otherwise.
Any claims that solar activity is causing short term climate change over the course of a hundred years or so are speculation at this point in time.
Scientifically speaking when the proposed unusual minimum begins around 2015 no significant changes in the earths temperature can be expected from any known established science.
|
|
|
|
Post by icefisher on Sept 18, 2013 20:19:44 GMT
Cuttydyer Whats your point here? There are no established statistically significant links to changing climate and solar activity. This is not true. It is true that sunspot numbers are poor indicators of solar activity, at least when you are forced to pad future numbers to smooth shorter term cycles. But its also true if you xray a bunch of bananas for its influence on the climate you won't find a correlation. In statistics there is no negative conclusion to draw other than about your technique being successful or not. For every successful correlation there are an infinite number of failed correlations; its hard to imagine that the paper that Numno is using has any utility beyond politics. All statistics can give you in single world situations are hints of where to look for causation. But if you are going to do that you have to avoid being a moron and throwing the baby out with the bathwater. Already provided to you nimrods is: sait.oat.ts.astro.it/MmSAI/76/PDF/969.pdfPrimary conclusion:
"So the sunspot number is not a good indicator of solar activity, and using the sunspot number
leads to the under-estimation of the role of solar activity in the global warming."Clues are hard to catch for some of us around here but try real hard on this one! Using a different database as representative of solar activity you get this: 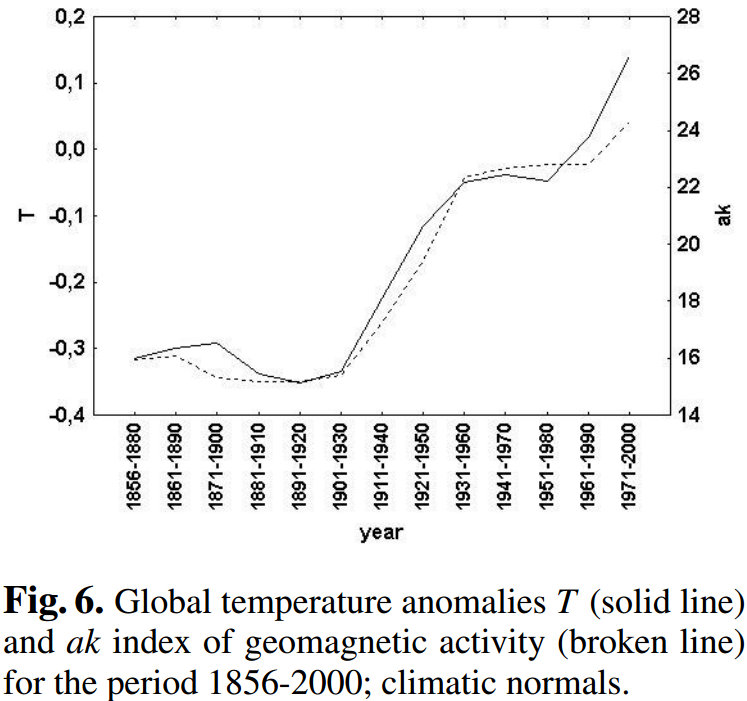 One can legitimately argue that such correlations fall short of proof, but its also just as clear a different dataset of solar activity that fails to show a correlation says nothing whatsoever or at all about datasets that do show correlations. So the next step is trying to avoid being a moron and concluding "There are no established statistically significant links to changing climate and solar activity." when you have been shown clearly that there is. I have no idea where you guys dreamed up the idea that if bananas don't correlate nothing will. |
|
|
|
Post by douglavers on Sept 18, 2013 20:25:22 GMT
The last quarter of the twentieth century was characterised by an extremely active sun. The planet warmed a bit, which may or may not be correlated with that level of activity.
That activity has now reversed, and we appear to be facing some sort of Grand Minimum.
We are now in the middle of a fascinating geophysical experiment.
All the talk about correlations in the posts above (ignoring ad hominem comments) is going to be subsumed into the results of this experiment over the next five years. I suspect that a great many theories are going to crash, and egg supplies are going to be severely depleted.
BTW, I hope that Svensmark is wrong. This is hope rather than expectation. If he eventually receives a Nobel, we are all in serious trouble.
|
|
|
|
Post by magellan on Sept 20, 2013 3:27:51 GMT
|
|
|
|
Post by magellan on Sept 20, 2013 3:31:34 GMT
|
|


