|
|
Post by acidohm on Aug 12, 2017 16:05:39 GMT
You're right, and as a 'watcher' of Adapt 2030, I'm sure you have seen their take on that issue ... along with Astro's, Naut's and other's supplements of extremes. What is missing however is a reliable means to quantify these changes against other time periods. I have access to no data base that, given my equipment (and time) would allow me to generate any such statistic. An increase in cold events making the news might be indicative as AGWers have not yet morphed an answer for that. Extreme rainfall events they are already tagging with a CO2 label ... although they are not explaining 'how'. Perhaps someone is already attempting such a statistic ... but, if so, is the source suspect? Lies, damned lies and statistics ... you know the types. How do you know they're lying? Their mouth is open.  Such a statistic would be very telling perhaps ... if you could verify it. missouriboy, To the best of my knowledge there is no global severe weather index we could use as a metric to verify if extreme weather events are on the rise or decline. There always has been extremes in our weather and probably always will be. Mr. Dubyne over at Adapt2030 does a great job "reporting" on cold records being broken, flooding, snows etc. But he could just as easily do the same videos about record heat and drought. So much of it is regionalized and we don't have much of a base line. Too much has been made of the ACE index and anybody who has watched the tropics over the decades knows that they name storms that would not have been issued a name a few decades ago. Then there seems to be a warming bias with the media and models alike. So taking all this into consideration I am closely following agricultural commodity prices. If we are experiencing: "Global cooling, torrential rains, floods" as the title of this thread suggests it will show up in commodity prices first. I fully acknowledge that there are other things that could drive food prices up like inflation, fuel costs or a economic boom. But if we truly do experience abrupt global cooling there is no way the media, IPCC or anybody will be able to hide the food price increase. The proof will be in the pudding. Governments could start subsidising it as if its an electric car company??? |
|
|
|
Post by sigurdur on Aug 12, 2017 16:14:26 GMT
The Mississippi and Nile rivers both show flow correlation to solar cycles. We have been at the Apex of our 160 year hydro pattern and have not thought to look at that Missouri. Deff food for further research! Indeed that looks to be the case, although there appear to be lags and probably other factors. In the western Grain Belt cross section the southern stations have greater variance whose highs may hang on longer than the northern stations. There also appears a large initial upward movement followed by a long, slower decline. The declines seem to continue into the new solar upturns with a sharp bounce due to whatever (that's a technical term ). The eastern cross section shows a similar but more consistent (less variable) nature. The second half of the grand maximum has been wetter in the east than the first half. Both areas seem to be on their way down. 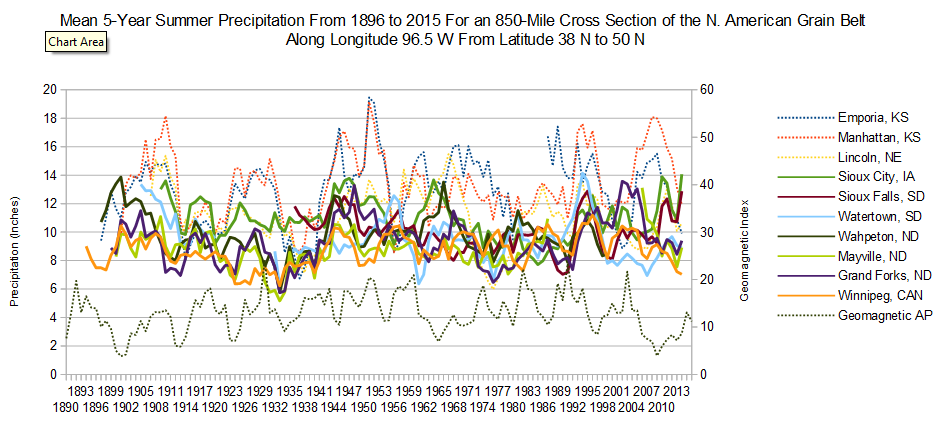 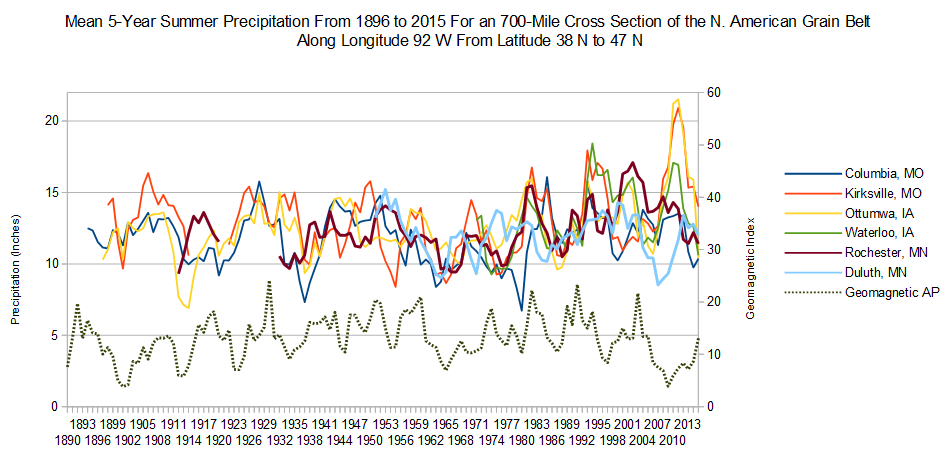 Big enough screen now to start looking at your graphs in detail Missouri. Going to let it rattle around a bit, and look again in a day. |
|
|
|
Post by missouriboy on Aug 12, 2017 17:25:57 GMT
You're right, and as a 'watcher' of Adapt 2030, I'm sure you have seen their take on that issue ... along with Astro's, Naut's and other's supplements of extremes. What is missing however is a reliable means to quantify these changes against other time periods. I have access to no data base that, given my equipment (and time) would allow me to generate any such statistic. An increase in cold events making the news might be indicative as AGWers have not yet morphed an answer for that. Extreme rainfall events they are already tagging with a CO2 label ... although they are not explaining 'how'. Perhaps someone is already attempting such a statistic ... but, if so, is the source suspect? Lies, damned lies and statistics ... you know the types. How do you know they're lying? Their mouth is open. Such a statistic would be very telling perhaps ... if you could verify it. missouriboy, To the best of my knowledge there is no global severe weather index we could use as a metric to verify if extreme weather events are on the rise or decline. There always has been extremes in our weather and probably always will be. Mr. Dubyne over at Adapt2030 does a great job "reporting" on cold records being broken, flooding, snows etc. But he could just as easily do the same videos about record heat and drought. So much of it is regionalized and we don't have much of a base line. Too much has been made of the ACE index and anybody who has watched the tropics over the decades knows that they name storms that would not have been issued a name a few decades ago. Then there seems to be a warming bias with the media and models alike. So taking all this into consideration I am closely following agricultural commodity prices. If we are experiencing: "Global cooling, torrential rains, floods" as the title of this thread suggests it will show up in commodity prices first. I fully acknowledge that there are other things that could drive food prices up like inflation, fuel costs or a economic boom. But if we truly do experience abrupt global cooling there is no way the media, IPCC or anybody will be able to hide the food price increase. The proof will be in the pudding. Agreed. You can't fool the markets for long. My gut tells me that the wet and windy extremes occur along 'edges' (contact zones between contrasting air masses) and that such edges should expand in a 'loopy jet' environment. Droughts (hot/dry) and cold may be more associated with the centers of larger air masses (off the cuff). I believe that the larger data bases have enough data and the computing power to derive a semblance of such indexes. I doubt they have the will as the results could be inconvenient. |
|
|
|
Post by missouriboy on Aug 12, 2017 17:35:57 GMT
I decided to change my presentation 'MO'. The following two charts show weekly moving averages of maximum and minimum temperatures compared to 1981-2010 normal 90th and 10th percentiles ... very similar to the arctic temp charts that are presented frequently around here. My initial impression is that they look very much like these arctic charts ... warmer winters, cooler summers. 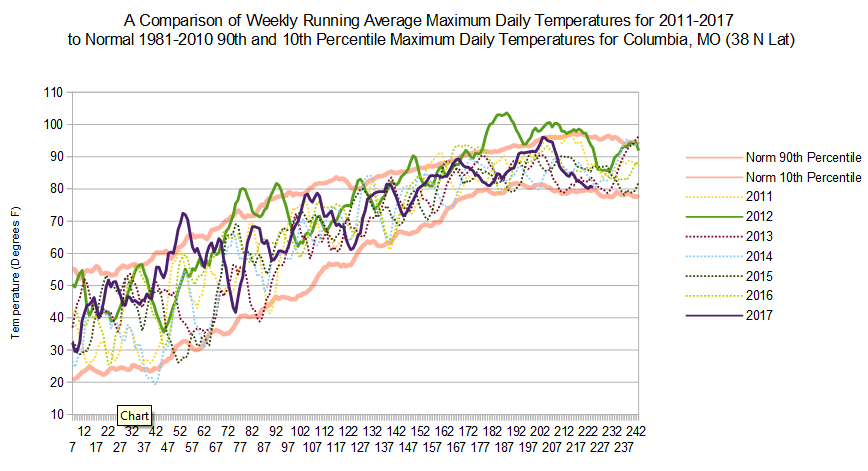 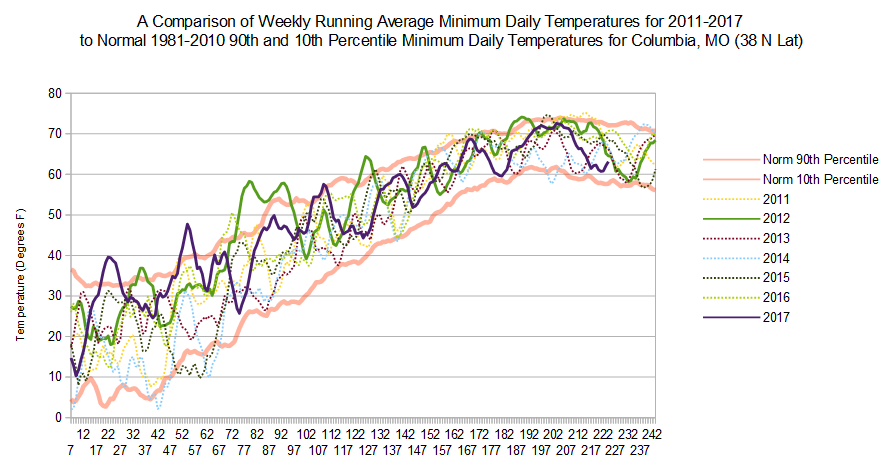 |
|
|
|
Post by glennkoks on Aug 12, 2017 18:04:41 GMT
missouriboy, To the best of my knowledge there is no global severe weather index we could use as a metric to verify if extreme weather events are on the rise or decline. There always has been extremes in our weather and probably always will be. Mr. Dubyne over at Adapt2030 does a great job "reporting" on cold records being broken, flooding, snows etc. But he could just as easily do the same videos about record heat and drought. So much of it is regionalized and we don't have much of a base line. Too much has been made of the ACE index and anybody who has watched the tropics over the decades knows that they name storms that would not have been issued a name a few decades ago. Then there seems to be a warming bias with the media and models alike. So taking all this into consideration I am closely following agricultural commodity prices. If we are experiencing: "Global cooling, torrential rains, floods" as the title of this thread suggests it will show up in commodity prices first. I fully acknowledge that there are other things that could drive food prices up like inflation, fuel costs or a economic boom. But if we truly do experience abrupt global cooling there is no way the media, IPCC or anybody will be able to hide the food price increase. The proof will be in the pudding. Agreed. You can't fool the markets for long. My gut tells me that the wet and windy extremes occur along 'edges' (contact zones between contrasting air masses) and that such edges should expand in a 'loopy jet' environment. Droughts (hot/dry) and cold may be more associated with the centers of larger air masses (off the cuff). I believe that the larger data bases have enough data and the computing power to derive a semblance of such indexes. I doubt they have the will as the results could be inconvenient. missouriboy, I think you are absolutely correct. A loopy jet would bring rapidly changing conditions from wet and cold to hot and dry making farming that much more difficult. Conditions that were well documented by f*gan in "The Little Ice Age". The warm relatively stable climate during the MWP gave way to a cold unstable climate pattern. |
|
|
|
Post by acidohm on Aug 12, 2017 18:22:08 GMT
The polar vortex and jetstream are like a spinning top i think...
Enough energy and it spins straight, reduce the energy and then the wobble appears...
I could also hypothesis this perhaps being a reason behind an idea i had about a tipping point in solar activity effect, where above a certain level of solar activity the energy spins the zonal effect strongly. Below a certain point, wobble manifests itself.
This could account for a lack of solar signal in the longterm weather record??
|
|
|
|
Post by missouriboy on Aug 12, 2017 19:18:28 GMT
The polar vortex and jetstream are like a spinning top i think... Enough energy and it spins straight, reduce the energy and then the wobble appears... I could also hypothesis this perhaps being a reason behind an idea i had about a tipping point in solar activity effect, where above a certain level of solar activity the energy spins the zonal effect strongly. Below a certain point, wobble manifests itself. This could account for a lack of solar signal in the longterm weather record?? Actually I think there is a pretty strong solar signal in the longterm weather record. It's the other poorly understood but probably related embedded variables that muddy the longer term wiggles. We just really don't understand the leads, the lags and the sags ... and the thresholds as you say. |
|
|
|
Post by nautonnier on Aug 13, 2017 6:04:27 GMT
The polar vortex and jetstream are like a spinning top i think... Enough energy and it spins straight, reduce the energy and then the wobble appears... I could also hypothesis this perhaps being a reason behind an idea i had about a tipping point in solar activity effect, where above a certain level of solar activity the energy spins the zonal effect strongly. Below a certain point, wobble manifests itself. This could account for a lack of solar signal in the longterm weather record?? To quote the IPCC: "In climate research and modelling, we should recognise that we are dealing with a coupled non-linear chaotic system" So what does that statement really mean? There are several types of chaotic systems, but by looking at the history of the Earth's climate it would appear that the coupled non-linear chaotic system has at least one 'strange attractors' with different phases. see en.wikipedia.org/wiki/Chaos_theory#Strange_attractors and if you want more www.siam.org/students/siuro/vol4/S01079.pdf. Using a Poincare Section diagram a chaotic system can be shown to have an attractor that may have different 'states'  or  So the Earth's climate may move from one state (attractor) to another state (attractor) due to coincidence of particular values. This is not a tipping point, which infers a non-recoverable change, it is a change to a different stable state in which the same variables now orbit a different attractor until some coincidence of values changes to the other state. So we are in an interglacial in an ice age at the moment we can move to an attractor which is a full glacial, or presumably move out of the ice age and back to tropical warmth for the entire planet of a non-glacial. Or perhaps something in the tectonic movements of the continents means that the variables required for the attractor full tropical warmth of the non-glacial cannot be attained for centuries. The issue for wiggle watchers is that this is not a classical Fourier transform set of cycles that will repeat endlessly. At some stage a coincidence of values (the oft quoted butterfly wing) at _just_the_right_time_ to be coincident and the climate will move to an alternate strange attractor state remaining in that phase space until another set of coincident values move it back. The IPCC said that forecasting the future state of a coupled non-linear chaotic system was infeasible. However, there may be ways to forecast points at which there may very likely be shifts to different orbits around the attractor or changes to a different attractor. In some ways I believe this may be Theo's approach. |
|
|
|
Post by acidohm on Aug 13, 2017 7:43:05 GMT
Thx Naut, that makes alot of sense, great rundown on the subject!!
|
|
|
|
Post by graywolf on Aug 13, 2017 18:21:26 GMT
And it also fleshes out my way of looking at things with mother N. battling to keep things stable up to a point ( a tipping point) where the climate steps up to the next stable point?
This is where I believe us to be today. Only that normally Mother N. has thousands of years to uhmm and ahhh about whether it's just weather or a major shift in climate....... this time we've pushed so hard that we are already at GHG, levels that demand 2/3rds of Greenland lose its ice and all of west Antarctica.
The question has to be can she effect change at the same rate that we can force her?
The discovery of the Antarctic rift system puts degalciation of West Antarctica ( and the total loss of Ross ice shelf and the 7m of sea level rise it brings with it!)well within a normal life time esp. if Ross goes first!!
|
|
|
|
Post by nautonnier on Aug 13, 2017 18:32:08 GMT
And it also fleshes out my way of looking at things with mother N. battling to keep things stable up to a point ( a tipping point) where the climate steps up to the next stable point? This is where I believe us to be today. Only that normally Mother N. has thousands of years to uhmm and ahhh about whether it's just weather or a major shift in climate....... this time we've pushed so hard that we are already at GHG, levels that demand 2/3rds of Greenland lose its ice and all of west Antarctica. The question has to be can she effect change at the same rate that we can force her? The discovery of the Antarctic rift system puts degalciation of West Antarctica ( and the total loss of Ross ice shelf and the 7m of sea level rise it brings with it!)well within a normal life time esp. if Ross goes first!! If you understand the gas laws and adiabatic lapse rates Graywolf you have no concern about so called 'greenhouse gases'. It is a falsified hypothesis. |
|
|
|
Post by acidohm on Aug 13, 2017 18:35:10 GMT
There is nothing to suggest any changes that take a millenia to occur will suddenly happen any more quickly then have ever happened before....
The best thing about our situation is one side expects a shift up, the other a shift down.
Someone is seeing the circumstances with biased eyes, i suspect the majority will accept the outcome in 5 years or so.
But there will always be a few.....
|
|
|
|
Post by graywolf on Aug 13, 2017 18:38:57 GMT
And it also fleshes out my way of looking at things with mother N. battling to keep things stable up to a point ( a tipping point) where the climate steps up to the next stable point? This is where I believe us to be today. Only that normally Mother N. has thousands of years to uhmm and ahhh about whether it's just weather or a major shift in climate....... this time we've pushed so hard that we are already at GHG, levels that demand 2/3rds of Greenland lose its ice and all of west Antarctica. The question has to be can she effect change at the same rate that we can force her? The discovery of the Antarctic rift system puts degalciation of West Antarctica ( and the total loss of Ross ice shelf and the 7m of sea level rise it brings with it!)well within a normal life time esp. if Ross goes first!! If you understand the gas laws and adiabatic lapse rates Graywolf you have no concern about so called 'greenhouse gases'. It is a falsified hypothesis. And mass loss of ice over these newly discovered volcanoes ( outnumbering the great African rift system) does not isostatic rejuvination not demand their burst into activity ( including the 5 or so under Ross). AcidHom is right about 5 years though , we will know , if trump lets us live, by then. |
|
|
|
Post by acidohm on Aug 13, 2017 18:42:57 GMT
Agreed on trump!!!!!!!!!
|
|
|
|
Post by sigurdur on Aug 13, 2017 18:48:40 GMT
With President Trump I expect to live to a ripe old age. I was very concerned if Mrs. Clinton got elected, that our lifespan would be cut dramatically.
I don't think most folks knew what a WarMonger Mrs. Clinton is.
|
|


 Such a statistic would be very telling perhaps ... if you could verify it.

