|
|
Post by glennkoks on Aug 9, 2017 13:26:18 GMT
It certainly not apocolyptic but I found this youtube channel that chronicles extreme events around the globe with live cell phone footage. Some pretty extreme weather events in Mexico and Russia this week. www.youtube.com/watch?v=WniMqMX0jO4 |
|
|
|
Post by sigurdur on Aug 9, 2017 13:35:21 GMT
Has there been an increase? Or does everyone having a phone that can video now days provide a platform to share normal events?
|
|
|
|
Post by nautonnier on Aug 9, 2017 14:35:26 GMT
Has there been an increase? Or does everyone having a phone that can video now days provide a platform to share normal events? Difficult to tell- but the MSM are in a fugue about Trump and news of any other type is of zero interest to them |
|
|
|
Post by missouriboy on Aug 9, 2017 15:53:39 GMT
Has there been an increase? Or does everyone having a phone that can video now days provide a platform to share normal events? Nobody captures 'normal' events. They don't sell on youtube ... or so my son tells me.  Grim and grimmer get hits ... and youtube apparently pays in blocks after a minimum number of hits. If the world ends tomorrow, you'll probably see it first on youtube ... unless of course it's an EMP, in which case modern journalism really will die in darkness. |
|
|
|
Post by glennkoks on Aug 10, 2017 3:54:57 GMT
Has there been an increase? Or does everyone having a phone that can video now days provide a platform to share normal events? Good question. Personally I doubt there has been a statistical increase in these events. It's just captured so much more often and aired on youtube. At any given time there are extreme events happening somewhere on this earth. With that being said there seems to be a lot of internet chatter about how cool this summer has been for a good portion of the U.S. and Canada. We will see if this is just a "cooler" summer or a trend. It certainly has not been cool of late in the Pacific NW. |
|
|
|
Post by Ratty on Aug 10, 2017 6:28:31 GMT
Has there been an increase? Or does everyone having a phone that can video now days provide a platform to share normal events? You've probably seen Pielke Jr's testimony: |
|
|
|
Post by glennkoks on Aug 10, 2017 13:19:21 GMT
Since there has not been a statistical increase in the number of droughts, floods, tornados and hurricanes during the recent warming trend, is it correct to assume we will experience more severe weather as we head into what many have forecasted as a period of abrupt cooling? The tumultuous weather that occurred between the MWP and LIA is well chronicled. It would stand to reason that any abrupt change would be accompanied by an increase in extreme events. Hence these events would be a harbinger that "something" is a little weird?
|
|
|
|
Post by missouriboy on Aug 10, 2017 17:57:07 GMT
Since there has not been a statistical increase in the number of droughts, floods, tornados and hurricanes during the recent warming trend, is it correct to assume we will experience more severe weather as we head into what many have forecasted as a period of abrupt cooling? The tumultuous weather that occurred between the MWP and LIA is well chronicled. It would stand to reason that any abrupt change would be accompanied by an increase in extreme events. Hence these events would be a harbinger that "something" is a little weird? You're right, and as a 'watcher' of Adapt 2030, I'm sure you have seen their take on that issue ... along with Astro's, Naut's and other's supplements of extremes. What is missing however is a reliable means to quantify these changes against other time periods. I have access to no data base that, given my equipment (and time) would allow me to generate any such statistic. An increase in cold events making the news might be indicative as AGWers have not yet morphed an answer for that. Extreme rainfall events they are already tagging with a CO2 label ... although they are not explaining 'how'. Perhaps someone is already attempting such a statistic ... but, if so, is the source suspect? Lies, damned lies and statistics ... you know the types. How do you know they're lying? Their mouth is open. Such a statistic would be very telling perhaps ... if you could verify it. |
|
|
|
Post by nautonnier on Aug 10, 2017 18:48:31 GMT
Since there has not been a statistical increase in the number of droughts, floods, tornados and hurricanes during the recent warming trend, is it correct to assume we will experience more severe weather as we head into what many have forecasted as a period of abrupt cooling? The tumultuous weather that occurred between the MWP and LIA is well chronicled. It would stand to reason that any abrupt change would be accompanied by an increase in extreme events. Hence these events would be a harbinger that "something" is a little weird? You're right, and as a 'watcher' of Adapt 2030, I'm sure you have seen their take on that issue ... along with Astro's, Naut's and other's supplements of extremes. What is missing however is a reliable means to quantify these changes against other time periods. I have access to no data base that, given my equipment (and time) would allow me to generate any such statistic. An increase in cold events making the news might be indicative as AGWers have not yet morphed an answer for that. Extreme rainfall events they are already tagging with a CO2 label ... although they are not explaining 'how'. Perhaps someone is already attempting such a statistic ... but, if so, is the source suspect? Lies, damned lies and statistics ... you know the types. How do you know they're lying? Their mouth is open. Such a statistic would be very telling perhaps ... if you could verify it. As even increased snowfall and freezes have already been claimed to be due to Global Warming they have already hedged their bets. At least the COP 21 has stalled otherwise any change in climatology for next year would be claimed to be the result of COP 21 taxation. |
|
dabba
New Member

Posts: 1 
|
Post by dabba on Aug 10, 2017 23:16:35 GMT
sig, the "flash drought" has reached nw Iowa. on par with 2012
|
|
|
|
Post by sigurdur on Aug 10, 2017 23:31:30 GMT
sig, the "flash drought" has reached nw Iowa. on par with 2012 Us in NE North Dakota as well. The soy number in today's report has to be an illusion. Too many acres that are really dry. Just can't see a large podset happening even if it rains an inch. We both know a small poor spot will bring a fields average yield down. A somewhat large bad spot will realllllllly bring the yield down. There is a somewhat large bad spot in soys/corn. |
|
|
|
Post by missouriboy on Aug 11, 2017 0:14:58 GMT
sig, the "flash drought" has reached nw Iowa. on par with 2012 Us in NE North Dakota as well. The soy number in today's report has to be an illusion. Too many acres that are really dry. Just can't see a large podset happening even if it rains an inch. We both know a small poor spot will bring a fields average yield down. A somewhat large bad spot will realllllllly bring the yield down. There is a somewhat large bad spot in soys/corn. The Amish community north of us was talking about that. Seems that some of their brethren to the north and west seem to be in that large patch. Sig and Naut. Do you believe there is an argument to be made that rainfall in the northern parts of 96-100 W Longitude is at least partially dependent on the strength of the subtropical gyre driving its moist payload further west and north during periods of high solar activity? With lower activity (read energy) these moisture sources retreat south and east. |
|
|
|
Post by sigurdur on Aug 11, 2017 13:19:51 GMT
The Mississippi and Nile rivers both show flow correlation to solar cycles. We have been at the Apex of our 160 year hydro pattern and have not thought to look at that Missouri. Deff food for further research!
|
|
|
|
Post by missouriboy on Aug 11, 2017 16:24:42 GMT
The Mississippi and Nile rivers both show flow correlation to solar cycles. We have been at the Apex of our 160 year hydro pattern and have not thought to look at that Missouri. Deff food for further research! Indeed that looks to be the case, although there appear to be lags and probably other factors. In the western Grain Belt cross section the southern stations have greater variance whose highs may hang on longer than the northern stations. There also appears a large initial upward movement followed by a long, slower decline. The declines seem to continue into the new solar upturns with a sharp bounce due to whatever (that's a technical term ). The eastern cross section shows a similar but more consistent (less variable) nature. The second half of the grand maximum has been wetter in the east than the first half. Both areas seem to be on their way down. 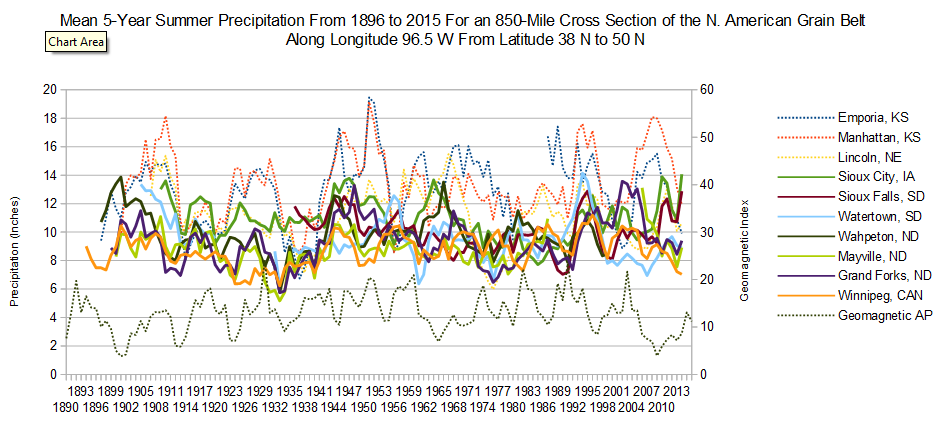 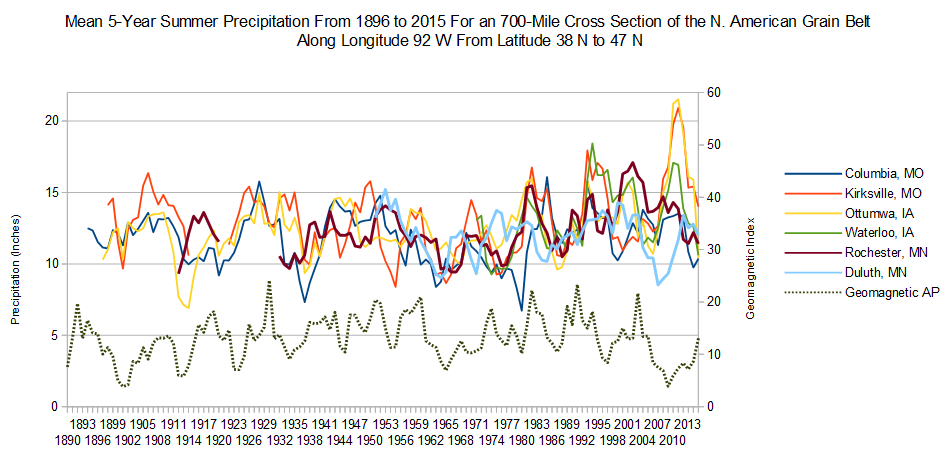 |
|
|
|
Post by glennkoks on Aug 12, 2017 15:06:25 GMT
Since there has not been a statistical increase in the number of droughts, floods, tornados and hurricanes during the recent warming trend, is it correct to assume we will experience more severe weather as we head into what many have forecasted as a period of abrupt cooling? The tumultuous weather that occurred between the MWP and LIA is well chronicled. It would stand to reason that any abrupt change would be accompanied by an increase in extreme events. Hence these events would be a harbinger that "something" is a little weird? You're right, and as a 'watcher' of Adapt 2030, I'm sure you have seen their take on that issue ... along with Astro's, Naut's and other's supplements of extremes. What is missing however is a reliable means to quantify these changes against other time periods. I have access to no data base that, given my equipment (and time) would allow me to generate any such statistic. An increase in cold events making the news might be indicative as AGWers have not yet morphed an answer for that. Extreme rainfall events they are already tagging with a CO2 label ... although they are not explaining 'how'. Perhaps someone is already attempting such a statistic ... but, if so, is the source suspect? Lies, damned lies and statistics ... you know the types. How do you know they're lying? Their mouth is open. Such a statistic would be very telling perhaps ... if you could verify it. missouriboy, To the best of my knowledge there is no global severe weather index we could use as a metric to verify if extreme weather events are on the rise or decline. There always has been extremes in our weather and probably always will be. Mr. Dubyne over at Adapt2030 does a great job "reporting" on cold records being broken, flooding, snows etc. But he could just as easily do the same videos about record heat and drought. So much of it is regionalized and we don't have much of a base line. Too much has been made of the ACE index and anybody who has watched the tropics over the decades knows that they name storms that would not have been issued a name a few decades ago. Then there seems to be a warming bias with the media and models alike. So taking all this into consideration I am closely following agricultural commodity prices. If we are experiencing: "Global cooling, torrential rains, floods" as the title of this thread suggests it will show up in commodity prices first. I fully acknowledge that there are other things that could drive food prices up like inflation, fuel costs or a economic boom. But if we truly do experience abrupt global cooling there is no way the media, IPCC or anybody will be able to hide the food price increase. The proof will be in the pudding. |
|


 Grim and grimmer get hits ... and youtube apparently pays in blocks after a minimum number of hits. If the world ends tomorrow, you'll probably see it first on youtube ... unless of course it's an EMP, in which case modern journalism really will die in darkness.