|
|
Post by cuttydyer on Sept 20, 2014 7:31:30 GMT
What's that smell - sulphur dioxide heading our way?  |
|
|
|
Post by cuttydyer on Sept 20, 2014 6:34:50 GMT
cutty take a look at the gulf stream .. to me it's slowing or being stopped by that lrg cold spot .. but I still believe it's to do with the cold coming from Antarctic .. but as we can only guess as icefisher has said we don't know to much about the ocean bottom or the cold Thermohaline.. but I have read about cold water jets moving very fast .. i'll guess these are more or less made up of fresher water(melted ice) allowing them to move faster .. but I'm sure over the next 10 yrs we will find out ... I agree, in the screen grab below it looks like the Subtropical Recirculation is healthy but the North Atlantic Circulation is very weak.  |
|
|
|
Post by cuttydyer on Sept 19, 2014 16:06:19 GMT
Impressive gain; it's looking pretty chilly down South:  |
|
|
|
Post by cuttydyer on Sept 19, 2014 13:16:43 GMT
Wow... the stick is back. ----SNIP PICCY------ Link: climate.gov/Is there somewhere that one can send an official complaint about that false claim? It would appear that NOAA has given up being objective & scientific because the science doesn't agree with their political position. This:  has become:  |
|
|
|
Post by cuttydyer on Sept 19, 2014 5:14:16 GMT
|
|
|
|
Post by cuttydyer on Sept 18, 2014 9:05:04 GMT
A new paper under discussion for Hydrology and Earth System Sciences finds recent floods in Britain are "not exceptional," "there appears to be no shift in long term flood frequency," and "The principal finding of this work is that of the strong correlation between flood-rich phases and solar magnetic activity."  Summary The apparent increase in flooding witnessed over the last decade appears in consideration of the long term flood record to be unexceptional, whilst the period since 2000 is considered as flood-rich, the period 1970–2000 is relatively “flood poor”, which may partly explain why recent floods are often perceived as extreme events. The much publicised (popular media) apparent change in flood frequency since 2000 may reflect natural variability, as there appears to be no shift in long term flood frequency (Fig. 4). In reviewing the flood series for European systems for which long flood series have been reconstructed, a complex picture is identified, whilst flood rich phases appear synchronous across many systems (ca. 1600 and 1765–1780), others show less synchronicity (1920s), whilst a number of prominent flood-rich phases at a European scale appear subdued or are not evident in the British FI (e.g. ca. 1740–1750). The principal finding of this work is that of the strong correlation between flood-rich phases and solar magnetic activity, indicating a clear driver for flooding patterns across Britain, what is still unclear is the relationship between the spatial/temporal distribution of flood clusters and solar activity. This work suggests that flood-rich periods relate to both positive and negative NAOI, with reasonable correspondence with previously diagnosed periods of climatic variability identified from individual series from across Europe. The inclusion of historical flood information provides a better understanding of long-term flood patterns. The detection of flood-rich periods and attribution to periods of climatic change are tentative. The historical records still hold a wealth of untapped information within the records for which specific discharges cannot be estimated, but from which indices could be extracted (Barriendos and Coeur, 2004). The wealth of information presented by the historical records presents valuable new information for flood risk assessment and management (Kjeldsen et al., 2014); as new flood chronologies become available, more detailed and complete indices based chronologies will improve the resolution and enhancing understanding of flood-rich and -poor periods, presenting a more complete depiction of the role of climate and extreme floods. Paper link: www.hydrol-earth-syst-sci-discuss.net/11/10157/2014/hessd-11-10157-2014.htmlSchtick take: hockeyschtick.blogspot.co.uk/2014/09/new-paper-finds-strong-correlation.html |
|
|
|
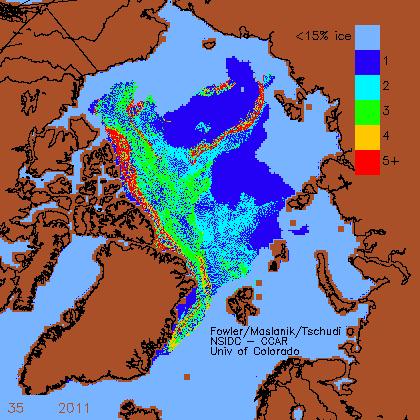
Post by cuttydyer on Sept 15, 2014 17:40:19 GMT
Great satellite image:  |
|
|
|
Post by cuttydyer on Sept 14, 2014 6:55:06 GMT
A little cheery viewing for a Sunday morning (peace was shattered one Sunday morning in 1783): A little background on the Laki fissures: The fissures opened up on each side, erupting over an eight-month period between 1783 and 1784. The eruption poured out an estimated 3.4 cubic miles (14 km3) of lava and clouds of poisonous hydrofluoric acid and sulfur dioxide compounds that killed more than 50% of Iceland’s livestock, and lead to a famine that killed approximately 25% of the island’s human population. Sulfur dioxide spewed into the Northern Hemisphere, causing a drop in global temperatures and the coldest winter in 250 years.. This caused crop failures in Europe and may even have caused droughts in India. The eruption has been estimated to have killed more than six million people globally, making it the deadliest eruption in historical times. It was the second greatest eruption of the last 1,000 years, behind only the 1815 eruption of Mount Tambora in Indonesia, says Stephen Self, visiting professor of volcanology at the Open University. Consequences in Europe The estimated 120,000,000 tons – 120 million tons! – of sulphur dioxide is about three times the total annual European industrial output in 2006, and equivalent to a 1991 Mount Pinatubo eruption every three days. While the Pinatubo eruption produced 17 tons of sulphur dioxide, Laki pumped out the same amount every three days at its peak, says Self. It belched more toxic gases than any eruption in the last 150 years. A thick haze – known as the “Laki haze” – spread down through Norway, Germany, France and across to Britain, causing panic when farm laborers began dropping like flies. (The sulphur dioxide was mixing with water vapor in the lungs to choke victims.) More than 20,000 deaths are estimated in Britain alone during the summer of 1783. Laki contributed significantly to several years of extreme weather in Europe, leading to an increase in poverty and famine that may have contributed to the French Revolution in 1789. Studies also suggest that there was an unusually strong El Niño effect from 1789 to 1793. Consequences in North America In North America, the winter of 1784 was the longest and one of the coldest ever recorded. It brought the longest period of below-zero temperatures in New England, the largest accumulation of snow in New Jersey, and the longest freezing over of the Chesapeake Bay, where Annapolis, Maryland is located A huge snowstorm hit the south, the Mississippi River froze at New Orleans and there was ice in the Gulf of Mexico. en.wikipedia.org/w/index.php?title=Lakinews.bbc.co.uk/1/hi/8624791.stm |
|
|
|
Post by cuttydyer on Sept 14, 2014 6:47:09 GMT
|
|
|
|
Post by cuttydyer on Sept 11, 2014 7:17:40 GMT
The Schtick reports: New paper finds Indian climate is influenced by solar activity  A paper published today in Advances in Space Research finds "Indian climate appears to be influenced by solar variability" and the "mechanism for the Sun–climate relationship may be related solar polarity also." The authors conclude, "Comparison of the relationships between the Indian temperature anomalies and solar activity (SSN) provides evidence favouring a mechanism that depends not only on the level of sunspot activity but also on solar polarity." and in turn show that this may be related to Svensmark's cosmic ray theory of climate [one of many solar amplification mechanisms described in the scientific literature]: "Reversal in the polarity of the solar polar magnetic field takes place near the solar activity maximum in each solar cycle, and the large-scale interplanetary magnetic field is an extension of the solar polar magnetic field in space (Smith et al., 1978). It is also known that the large-scale structure of the interplanetary magnetic field is of basic importance for the long-term modulation of galactic cosmic rays (Venkatesan and Badruddin, 1990, Kudela et al., 2000 and Badruddin et al., 2007). There are indications that long-term variability in cosmic ray intensity influences the Earth’s climate (Svensmark and Friis-Christensen, 1997, Kirkby, 2007 and Rao, 2011). Thus, we have studied the Sun–climate relationship by averaging the data over the time scales of solar polarity epoch (peak to peak SSN). Averaged over this time scale, we found a significant improvement in correlation between and temperature anomalies as compared to decadal and solar activity cycle timescales." Abstract We use Indian temperature data of more than 100 years to study the influence of solar activity on climate. We study the Sun–climate relationship by averaging solar and climate data at various time scales; decadal, solar activity and solar magnetic cycles. We also consider the minimum and maximum values of sunspot number (SSN) during each solar cycle. This parameter SSN is correlated better with Indian temperature when these data are averaged over solar magnetic polarity epochs (SSN maximum to maximum). Our results indicate that the solar variability may still be contributing to ongoing climate change and suggest for more investigations. Paper link: www.sciencedirect.com/science/article/pii/S0273117714003810Schtick link: hockeyschtick.blogspot.co.uk/2014/09/new-paper-finds-indian-climate-is.html |
|
|
|
Post by cuttydyer on Sept 10, 2014 11:46:54 GMT
|
|
|
|
Post by cuttydyer on Sept 10, 2014 11:36:48 GMT
Wow.... they mentioned it. Is top down solar modulation finally going to get traction?: "But the study, published in the International Journal Of Climatology, states that it was extreme unlikely the clustering of extreme conditions had happened by chance. The trend could be due to random fluctuations in the climate system but could equally be due to factors including changing pressure and weather systems over the Arctic, especially Greenland, and changes in energy coming from the sun." |
|
|
|
Post by cuttydyer on Sept 10, 2014 5:03:40 GMT
|
|
|
|
Post by cuttydyer on Sept 9, 2014 15:31:46 GMT
BBC reports: Fabled Franklin Arctic ship found  Sir John Franklin and his crew were captured in this 1847 painting by W Turner Smith called The End In Sight One of two British explorer ships that vanished in the Arctic more than 160 years ago has been found, Canada's prime minister says. Stephen Harper said it was unclear which ship had been found, but photo evidence confirmed it was one of them. Sir John Franklin led the two ships and 129 men in 1845 to chart the Northwest Passage in the Canadian Arctic. The expedition's disappearance shortly after became one of the great mysteries of the age of Victorian exploration. The loss of HMS Erebus and HMS Terror prompted one of largest searches in history, running from 1848 to 1859. The search resulted in the discovery of the Northwest Passage, which runs from the Atlantic to the Pacific through the Arctic archipelago. A team of Canadian divers and archaeologists has been trying to find the ships since 2008. Link: www.bbc.co.uk/news/world-us-canada-29131757 |
|
|
|
Post by cuttydyer on Sept 5, 2014 19:18:38 GMT
What other species has been so determined to drive itself into extinction? Humans do better when they have warm shelter available in the winter. Or maybe we just need another round of institutional education to fully understand the bigger picture. And yet we still have the audacity to laugh at lemmings. |
|