|
|
Post by cuttydyer on Jan 23, 2015 5:48:24 GMT
Someone had mentioned the See/Saw effect of temperatures between the Arctic and Antarctic a while back. I knew I had read something, and just came across it. www.sciencemag.org/content/291/5501/109.short In general, Antarctic temperatures increased gradually while Greenland temperatures were decreasing or constant, and the termination of Antarctic warming was apparently coincident with the onset of rapid warming in Greenland. This pattern provides further evidence for the operation of a “bipolar see-saw” in air temperatures and an oceanic teleconnection between the hemispheres on millennial time scales. The see/saw Antarctic Arctic effect is captured in this graph from the 1990 IPCC report (page 224):  I predict the AGW crowds focus will see saw from the Arctic to the Antarctic when Arctic ice returns above mean & Antarctic ice drops below. 1990 IPCC report link: www.ipcc.ch/ipccreports/far/wg_I/ipcc_far_wg_I_full_report.pdf |
|
|
|
Post by cuttydyer on Jan 21, 2015 5:50:59 GMT
I try to follow up on the various predictions I make here and as soon as the Hadcrut4 anomaly is available for December 2014, I'll report on my long-term global temperature prediction. Today, I wanted to report on my prediction from a few years ago that the warmists will before too long begin to "discover" the natural 30-year "Ocean Current" cycle. Several months after I made the prediction, Kevin Trenberth, a warmist scientist, was quoted as saying there was a 30-year natural cycle which affected global temperatures. When I posted a link to this quote, "Steve", a warmist poster here, went ballistic and claimed that Trenberth was misquoted in the source because the writer of the article must have misunderstood what Trenberth was saying. (I wonder what happened to Steve.) Now, of all people, Gavin Schmidt, a warmist icon, seems to be publicly moving toward acceptance that the flat global temperature pause still has considerably more time to run and the pause is due to natural causes offsetting any greenhouse gas effects. From this linkNASA's Gavin Schmidt: the pause will not persist and in five to 10 years time - it is changes in greenhouse gases that will dominate.  Apparently, the natural solar cycle only has the ability to check or cool global temperatures not to raise. UPDATE: 24hrs later, "The Pause Is Dead"  Looks like Mikey & Gav don't have a 97% consensus between them! |
|
|
|
Post by cuttydyer on Jan 19, 2015 18:15:34 GMT
That's a fab web site, never tire of looking at it. Is the AMO about to take a dive?   Seeing as the RSS lower trop. temperatures correlate well with the AMO, I'm hoping it doesn't:  My pet theory regarding the apparent AMO / RSS link is that the AMO temps reflect changes in the global Thermohaline circulation which in turn impact global temps. |
|
|
|
Post by cuttydyer on Jan 17, 2015 16:29:00 GMT
I am sick in bed. To answer grey wolf requires a computer sorry to hear that. get well soon. 2nd that - get well soon Sig. |
|
|
|
Post by cuttydyer on Jan 17, 2015 12:33:23 GMT
you just couldn't make it up could you? errr, it appears you can... :  Care to comment GW? |
|
|
|
Post by cuttydyer on Jan 17, 2015 7:02:00 GMT
UHA thinks 2014 is 3rd warmest - no mention by BBC RSS thinks 2014 is 6th. warmest - no mention by BBC BEST states "The global surface temperature average for 2014 was nominally the warmest since the global instrumental record began in 1850; however, within the margin of error, it is tied with 2005 and 2010 and so we can’t be certain it set a new record." - no mention by the BBC Phew! At last! NOAA thinks 2014 is the hottest year ever! What's more! They are 48% certain! - BBC shouts it from the roof tops! BTW from NOAA's site "48% certainty" means "more unlikely than likely" Courtesy Mr Goddard: Data Tampering Courtesy NASA The graph below shows changes to NASA land-ocean temperature, since 2008. The years from 1910 to 1965 have been cooled, and subsequent years have been warmed. This creates a completely fake warming, and a record temperature with an error much larger than the claimed record delta.  2014 version : data.giss.nasa.gov/gistemp/graphs_v3/Fig.A2.txt 2008 version : data.giss.nasa.gov/gistemp/graphs/Fig.A2.txtSpreadsheet :Fig.A2.20080124.xls Here's an example of the results of data tampering: ___________________________________________________________________________ The satellite data (which for now, doesn't receive the tampering make-over) : RSS Lower Trop. Global Mean:  RSS Land Temp Global Mean:  Link: www.woodfortrees.org/plot/rss-land |
|
|
|
Post by cuttydyer on Jan 11, 2015 7:38:12 GMT
Courtesy of Steven Goddard:
Rules For Climate Radicals
.Refuse to believe any historical Arctic ice data which is not from satellites
.Ignore any Antarctic sea ice data which is from satellites
.Refuse to believe any temperature data which is from satellites
.Arctic air is very warm, until it comes to the US, where it becomes very cold
.Any cold location is weather
.Any warm location is climate
|
|
|
|
Post by cuttydyer on Jan 11, 2015 7:34:19 GMT
www.sciencedirect.com/science/article/pii/S0921818111001500The temperature of the warmest month was reconstructed for the past 2000 years using 748 pollen sites from the North American Pollen Database. The Modern Analog Technique was used to quantify paleoclimate conditions using a modern pollen database with calibration sites from across North America. Across North America, both the Medieval Warm Period (MWP) and Little Ice Age (LIA) were cooler than the present (AD 1961–1990). The MWP was warmer than the LIA over at least the boreal and eastern portions of the continent and perhaps across the continent. These reconstructed anomalies during the MWP and LIA are significant anomalies from the long-term neoglacial cooling. The atmospheric circulation was likely dominated by a poleward shift of the summer Subtropical High Pressure system in the North Atlantic during the MWP. Sig, Great find - to enable future reference, I've placed a link to this paper in the "Sun's Influence" thread. |
|
|
|
Post by cuttydyer on Jan 11, 2015 7:32:23 GMT
The Sun is the climate pacemaker I.Equatorial Pacific Ocean temperatures:  Abstract: Equatorial Pacific Ocean temperature time series data contain segments showing both a phase-locked annual signal and a phase-locked signal of period two years or three years, both locked to the annual solar cycle. Three such segments are observed between 1990 and 2014. It is asserted that these are caused by a solar forcing at a frequency of 1.0 cycle/yr. These periodic features are also found in global climate data (following paper). The analysis makes use of a twelve-month filter that cleanly separates seasonal effects from data. This is found to be significant for understanding the El Niño/La Niña phenomenon. Paper link: www.pas.rochester.edu/~douglass/papers/PLA_Sun_I_in_press.pdf |
|
|
|
Post by cuttydyer on Jan 4, 2015 19:55:23 GMT
Your chums are going to have to get very creative if / when it does...  How many years of back to back record warm years do you need to see and how far above 1c ,since the industrial rev., do you need temps to reach before accepting the planet is in trouble??? The industrial revolution occurred during the tail end of the Little Ice Age:  So after the LIA, exactly what should global temps do??? Let's see how much trouble the planet's in: RSS Global Land Temp anomaly is a tad above zero:  RSS Lower Trop. Global Mean is a whopping 0.256°C above (ties with 2007 as only the sixth warmest year since 1979):  And the Arctic... Currently at 11.5(million sq. km) - now well above the IPCC 1973 - 1990 mean:  above graph from the IPCC 1990 report (page 224) : www.ipcc.ch/ipccreports/far/wg_I/ipcc_far_wg_I_full_report.pdfNow global sea ice: 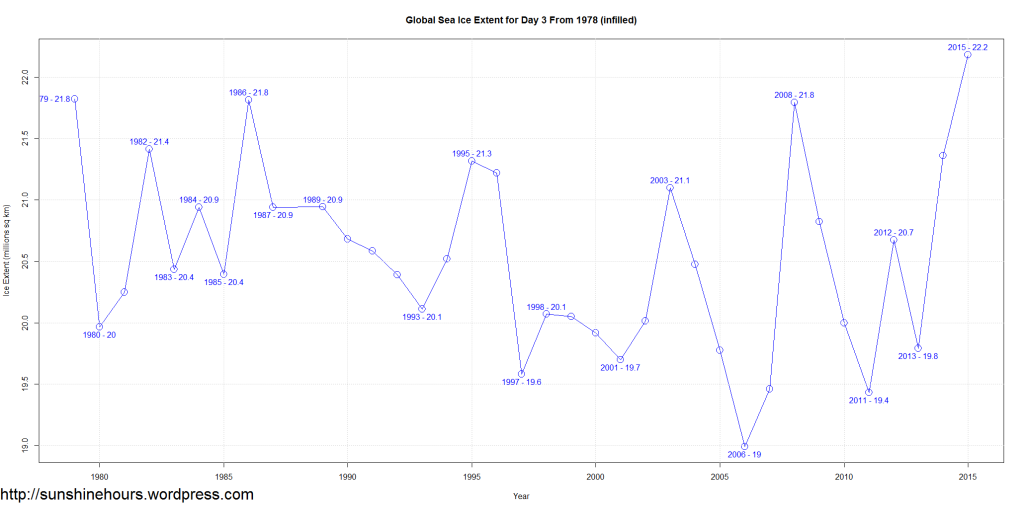 |
|
|
|
Post by cuttydyer on Jan 4, 2015 18:00:07 GMT
Your chums are going to have to get very creative if / when it does... |
|
|
|
Post by cuttydyer on Jan 4, 2015 16:26:05 GMT
|
|
|
|
Post by cuttydyer on Jan 2, 2015 9:20:36 GMT
Jo Nova has provided a summary of the Stephen Wilde hypothesis of top down solar modulation: In essence: The Sun affects the ozone layer through changes in UV or charged particles. When the Sun is more active there is more ozone above the equator and less over the poles, and vice versa. An increase in ozone warms the stratosphere or mesosphere, which pushes the tropopause lower. There is thus a solar induced see-saw effect on the height of the tropopause, which causes the climate zones to shift towards then away from the equator, moving the jet streams and changing them from “zonal” jet streams to “meridonal” ones. When meridonal, the jet streams wander in loops further north and south, resulting in longer lines of air mass mixing at climate zone boundaries, which creates more clouds. Clouds reflect sunlight back out to space, determining how much the climate system is heated by the near-constant incoming solar radiation. Thus the Sun’s UV and charged particles modulate the solar heating of the Earth. 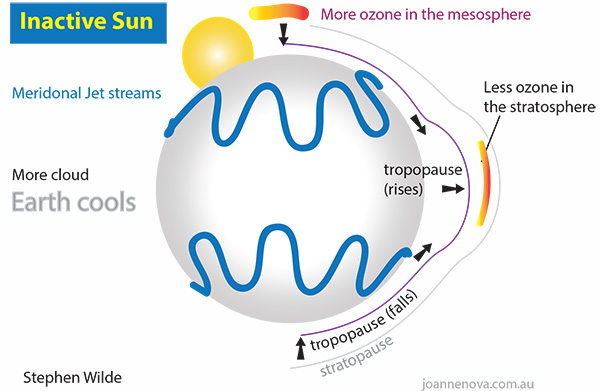 An active Sun increases ozone in the stratosphere: “Changes in solar ultraviolet spectral irradiance directly modify the production rate of ozone in the upper stratosphere (e.g. Brasseur, 1993), and hence it is reasonable to expect a solar cycle variation in ozone amount. The global satellite ozone records since 1979 show evidence for a decadal oscillation of total ozone with maximum amplitude (~2%) at low latitudes (Hood and McCormack, 1992; Chandra and McPeters, 1994; Hood, 1997). 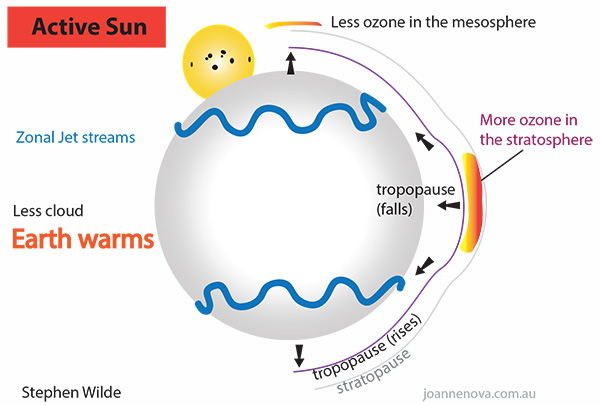 Link: joannenova.com.au/2015/01/is-the-sun-driving-ozone-and-changing-the-climate/ |
|
|
|
Post by cuttydyer on Dec 31, 2014 17:23:35 GMT
|
|
|
|
Post by cuttydyer on Dec 30, 2014 9:49:37 GMT
The elephant in the room has to be global temps? & here's what the elephant looks like: RSS Global Land Temp: RSS Lower Trop. Global Mean: |
|


