|
|
Post by nautonnier on Oct 24, 2020 14:18:57 GMT
I think this fits here....
|
|
|
|
Post by missouriboy on Oct 24, 2020 20:03:34 GMT
The above post reminded me that I had not revisited the HadSST3 ocean temperature anomaly estimates recently and compared them to the UAH Lower Troposphere measurements. Chart 1 is a display of HadSST3 (monthly Ocean temperature anomalies) for 1979 to September, 2020 to UAH Lower Troposphere temperature anomalies for the the Worlds's oceans for the same time period. It shows us there are much greater variances in the troposphere that generally mirror and lag ocean surface temperatures. 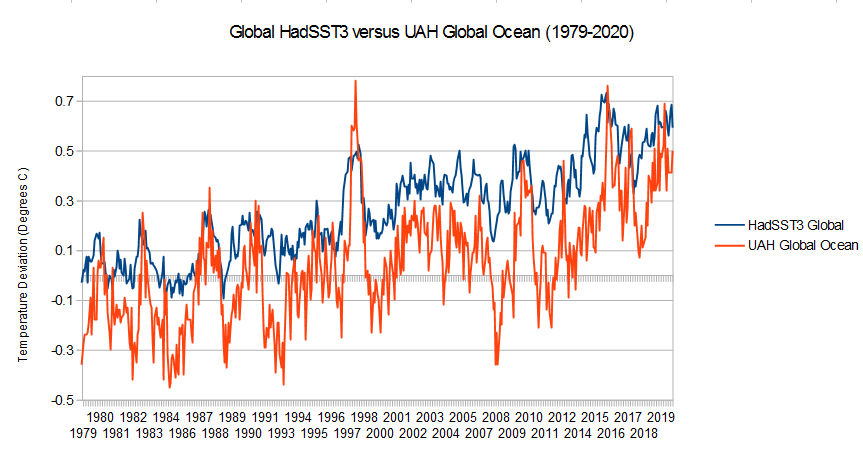 Chart 2 compares both series for the Northern Hemisphere, the Tropics and the Southern Hemisphere, with full-series trend lines superimposed. The tropics look comparable in both series. HadSST3 seems to show a slightly lower long-term trend than UAH in the Southern Hemisphere ... but, HadSST3 shows a much higher trend line than UAH in the Northern Hemisphere and it seems to be concentrated in the later half of the series. 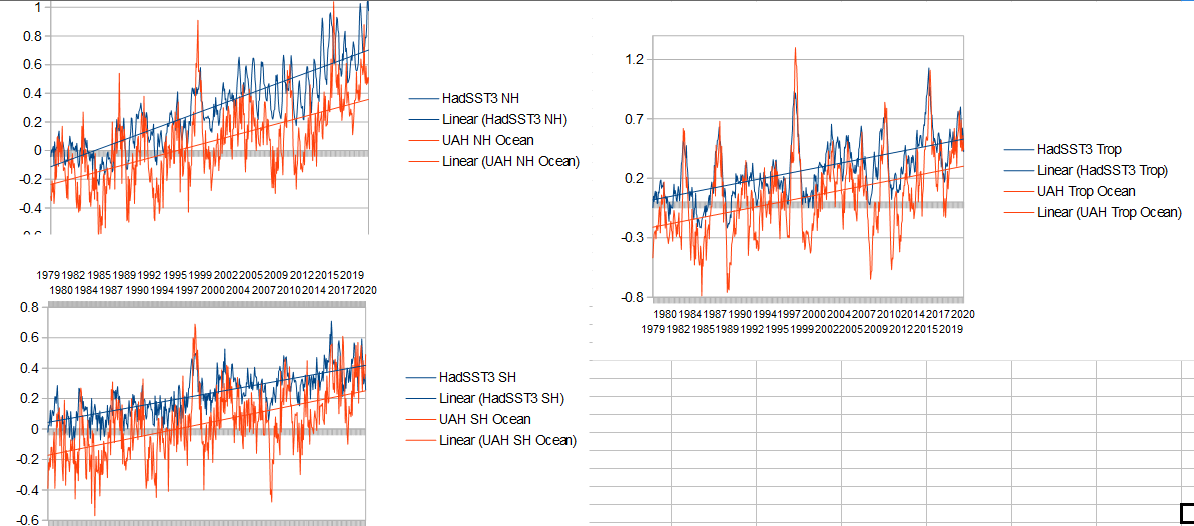 In Chart 3, I have divided Northern Hemisphere time series in halves and re-plotted the trend lines. The first half takes us through 1998. The light red trend line (based on 1978-1999 UAH data and its extension to 2020) shows that the upward slope in UAH temperature anomalies slowed in the later half of the time period. Comparatively, the HadSST3 dark blue trend line (based on the 2000-2020 HadSST3 data and its backward extension to 1978) shows that the upward slope in HadSST3 temperature anomalies has increased. Now perhaps someone could suggest to me a logical reason for that occurrence ... and why it only happened in the Northern Hemisphere. 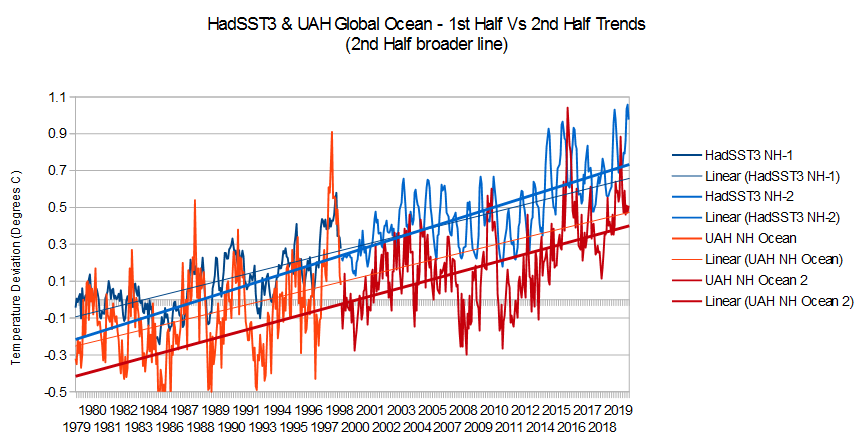 |
|
|
|
Post by nautonnier on Oct 29, 2020 23:28:36 GMT
|
|
|
|
Post by nautonnier on Oct 30, 2020 15:33:41 GMT
Something for Acid and MBoy to look at...
|
|
|
|
Post by acidohm on Oct 31, 2020 8:45:57 GMT
Something for Acid and MBoy to look at... Thx, been so busy at work I missed this one (I should really visit his profile once in a while) Peikko is next level climate analyser, not seen anyone output info like he does. Missouriboy close 2nd ❤ |
|
|
|
Post by nautonnier on Oct 31, 2020 12:09:43 GMT
Something for Acid and MBoy to look at... <<<SNIP>>>> Thx, been so busy at work I missed this one (I should really visit his profile once in a while) Peikko is next level climate analyser, not seen anyone output info like he does. Missouriboy close 2nd ❤ I am looking at the other end of the Gulf Stream it is getting cooler.  I am surprised Zeta managed to get to a 2 - the upper atmosphere must have been very favorable. Another more visual representation is 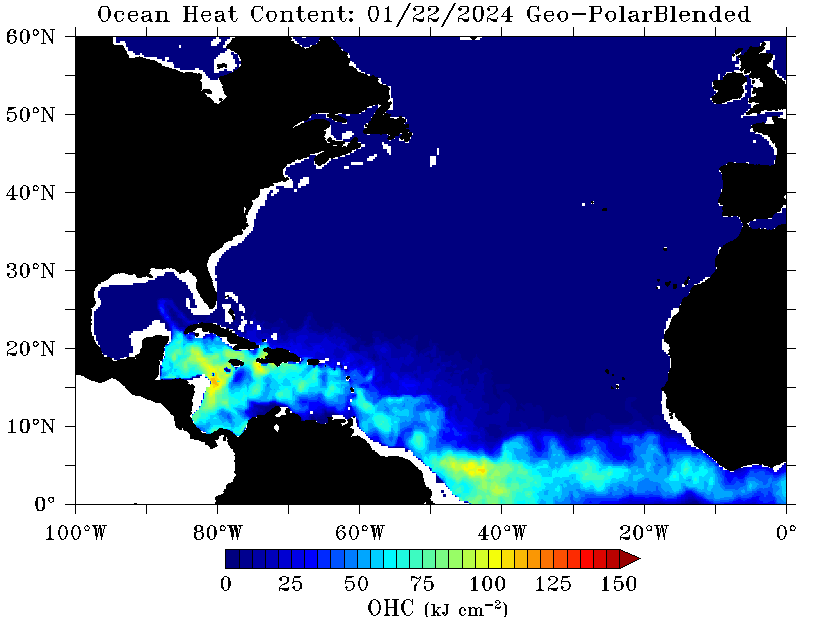 |
|
|
|
Post by missouriboy on Oct 31, 2020 15:16:39 GMT
I have forgotten his name ... but some 2(?) years back I had posted some charts and links regarding a proposed tie of alternating pulses of warm water into the North Atlantic being due to Lunar gravitational cycles. This would be on top of any AMO effect. I'm having a JD moment.
|
|
|
|
Post by nautonnier on Oct 31, 2020 16:30:13 GMT
 A JD Moment? |
|
|
|
Post by missouriboy on Oct 31, 2020 18:27:57 GMT
It's worse than I thought! I actually misspelled it too. I meant a JB (Joe Biden) moment. Will JD improve it?
|
|
|
|
Post by acidohm on Oct 31, 2020 19:23:07 GMT
It's worse than I thought! I actually misspelled it too. I meant a JB (Joe Biden) moment. Will JD improve it? It'll certainly reduce how much you worry about misspelling things 🤔 |
|
|
|
Post by nautonnier on Nov 23, 2020 18:35:59 GMT
That does not augur well as lots of pointers are that we could drop into another glaciation, the Little Ice Age was close but things _just_ recovered.
|
|
|
|
Post by nonentropic on Nov 23, 2020 19:48:57 GMT
To be fair we are in an interglacial and at the end, the Holocene. The period we are in is a Glacial and it dominates.
so 15,000years of interglacial 100,000years of glacial both numbers are approximate. Depending how you count we are in the last part of the Holocene and it is getting colder and will continue to do so, its only a question of when.
Humans survived the last Glacial phase and they will survive the next. The only question is how.
Scenario 1. 100 million hungry tropical wanderers who eat each other now and then, figuratively or maybe not.
Scenario 2. billions of folk more closely aligned to the tropics with nuclear or whatever energy to burn.
Lets hope we get to choose.
|
|
|
|
Post by missouriboy on Nov 24, 2020 17:32:27 GMT
AMO and CET Summer and Winter Temperatures (1856-2018)I was updating my AMO monthly temperature data and noticed a couple of charts that I don;t think I have posted before. These are only through 2018. Some quick observations without speculation on cause. Summer AMO and CET temperatures trend closely together except for 3 periods, when the CET is distinctively lower than the AMO. All three coincide with the known colder/low solar periods in the 1880s-90s, 1960s-70s and 2009-onward. Winter AMO and CET temperatures trend in distinctly different directions during different AMO cycles. It seems counter-intuitive, but CET winter temperatures are higher in negative AMO periods and lower during positive AMO periods. Someone care to speculate? 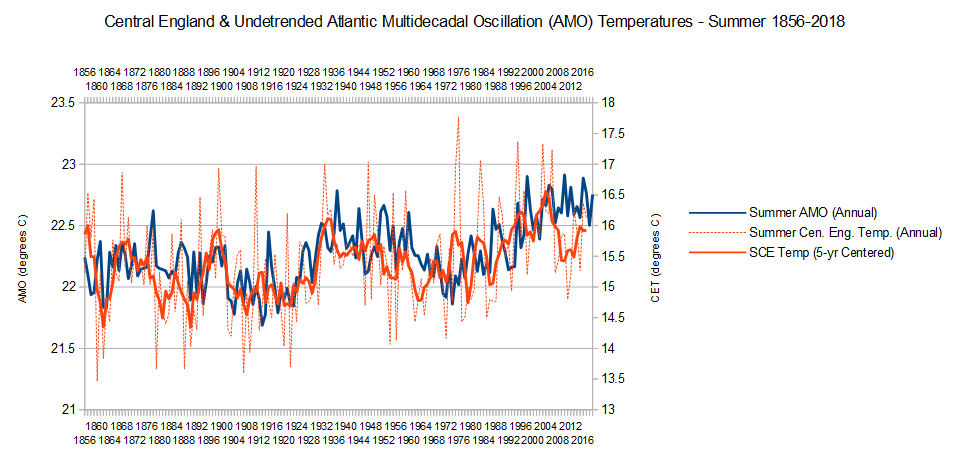 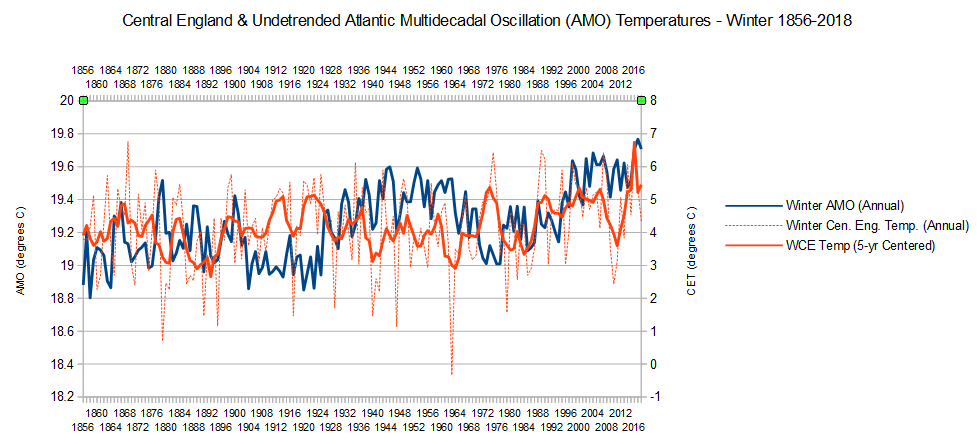
|
|
|
|
Post by sigurdur on Nov 29, 2020 0:53:52 GMT
journals.sagepub.com/doi/10.1177/0959683615580861. Reconstructed maximum and minimum bottom water temperatures for the assumed shell growth period between April and August of 15.2°C and 2.8°C imply a seasonality of about 12.4°C for the early Holocene. In comparison to modern temperatures, this indicates that average temperature declined by 6°C and seasonality narrowed by 50%. This first palaeo-environmental description of a fjord setting during the Holocene Climate Optimum at Spitsbergen exceeds most previous global estimates (+1–3°C) but confirms studies indicating an amplified effect (+4–6°C) at high northern latitudes.
|
|
|
|
Post by duwayne on Dec 12, 2020 23:32:43 GMT
One thing that has concerned me with respect to my prediction of very little warming during the 2007 to 2037 period is the fact that the detrended AMO has been elevated during 2020 rather than receding toward below zero anomalies. Finally November has dropped as shown in the skinny red line to the right of the chart to 0.1. Based on the historical 60 year cycle, we should see some negative numbers before long.  |
|